
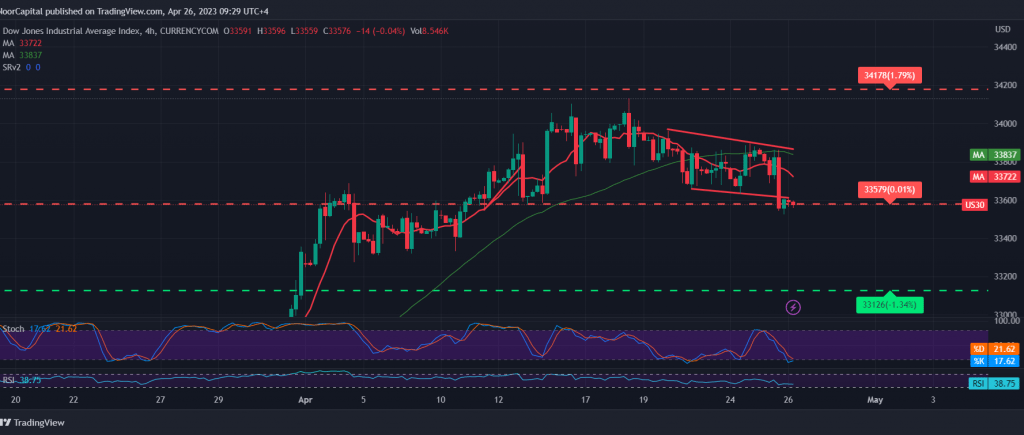
The Dow Jones Industrial Average found limited negative pressure during the previous trading session after colliding with the resistance level of 33,870, temporarily limiting the rise.
Technically, by looking closely at the 4-hour chart, we find that the simple moving average has returned to pressurize the price from above and constitutes an intraday obstacle, and this coincides with the decline in momentum over the short-term intervals.
With the stability of daily trading below the resistance level of 33,700 and 33,770, the bearish trend is the most preferred during daily trading, targeting 33,445 as the first target, and then 33,310 as the next station.
Note: The risk level is high.
Note: Trading on CFDs involves risks. Therefore, all scenarios may be possible. This article is not a recommendation to buy or sell but rather an explanatory reading of the price movement on the chart.
| S1: |