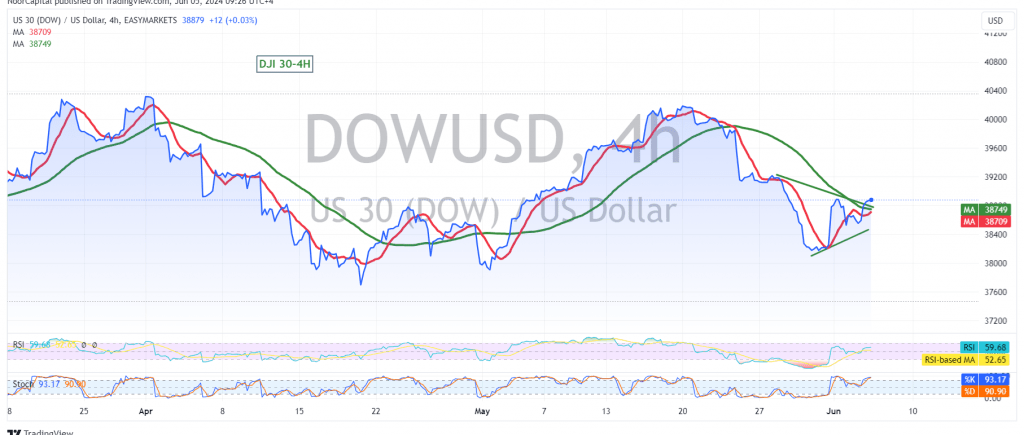
The Dow Jones Industrial Average is exhibiting signs of a potential rebound, having found support at the 38520 level and reaching a high of 38919 yesterday. Technical indicators suggest a cautiously optimistic outlook, but significant risks remain.
On the short-term timeframes, the simple moving averages are attempting to push the price higher, providing positive momentum. Additionally, the Relative Strength Index (RSI) is stabilizing above the 50 midline, further supporting the possibility of an upward move.
As long as intraday trading remains above the 38450 support level, a bullish scenario is likely. The next potential target is 38860, and a successful break above this level could pave the way for further gains.
However, traders should remain cautious, as a drop below 3845 could negate the bullish outlook and trigger a renewed downward trend. In this case, a retest of the 38360 support level is possible.
The release of high-impact economic data from the U.S. economy today, including job vacancies and labor turnover rate figures, could introduce significant volatility into the market. Investors should be prepared for potential price fluctuations in response to this news.
Additionally, ongoing geopolitical tensions continue to pose a risk of heightened volatility in the stock market. The potential for substantial price swings remains elevated, and traders should exercise prudence and adjust their strategies accordingly.
In conclusion, the Dow Jones Index is showing signs of a potential rebound, with technical indicators suggesting a cautiously optimistic outlook. However, significant risks remain, and traders should closely monitor key support and resistance levels while being prepared for potential volatility due to upcoming economic data and geopolitical events.
Disclaimer: Trading in CFDs carries inherent risks, and all scenarios are possible. This analysis is not investment advice but rather an interpretation of the current technical landscape for the Dow Jones Industrial Average.
| S1: |
 Noor Trends News, Technical Analysis, Educational Tools and Recommendations

