
The technical outlook remains unchanged, and the technical movements of the Dow Jones Industrial Average did not change significantly, maintaining the bullish path.
Technically, by looking closely at the 60-minute chart, the simple moving averages have returned to hold the price from below, and this comes in conjunction with the positive momentum signals coming from the 14-day momentum indicator.
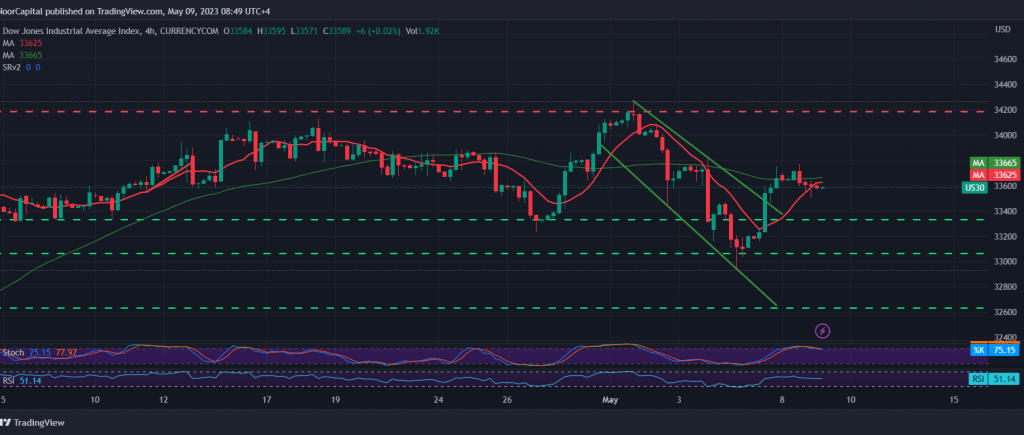
From here, with the stability of daily trading above the strong support floor at 33510, the bullish bias may be the most favorable during the day, provided that we witness a clear and strong breach of the resistance level of 33,690, targeting 33,740 as the first target, and the gains may extend later towards 33,890.
Note: Stochastic is around the intraday overbought areas, and we may witness some fluctuation until the official trend is obtained.
Welow 33,500 leads the indicator to achieve initial losses, starting at 33,350.
Note: The level of risk is high and may not be commensurate with the expected return, and all scenarios are open to occurrence.
Note: Trading on CFDs involves risks. Therefore, all scenarios may be possible. This article is not a recommendation to buy or sell but rather an explanatory reading of the price movement on the chart.
| S1: |