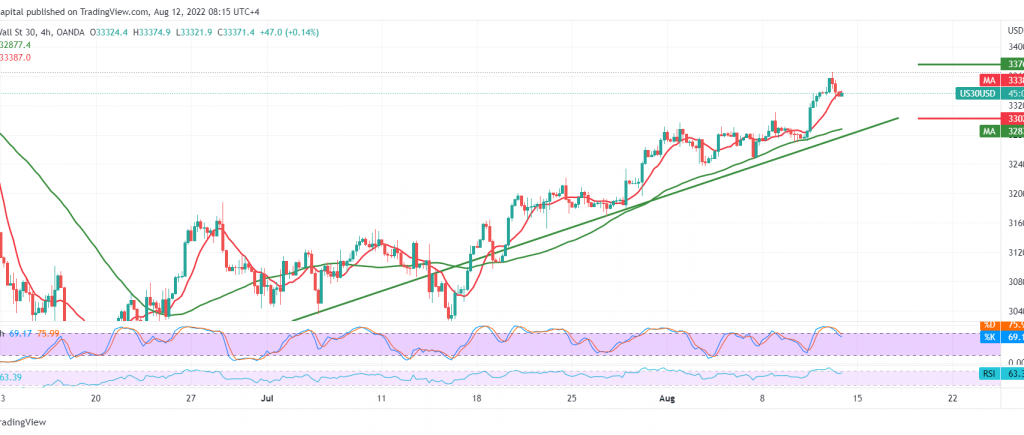
The Dow Jones Industrial Average achieved the required targets during the previous trading session, touching the first target 33,580 and approaching by a few points from the second target of 33,650, recording its highest level at 33,620.
Technically, and by looking at the 60-minute chart, we notice that the indicator continues to receive positive signs from the RSI stable above its mid-line, in addition to the positive motive of the 50-day simple moving average.
Therefore, the bullish scenario remains valid and effective, knowing that the breach of 33,350 extends the gains of the index and opens the doors towards 33,555 first target, and consolidation above increases and accelerates the strength of the bullish bias towards 33,770 as long as the price is stable above 33,110.
A drop below 33,110 will stop the positive moves and put the index price under negative pressure, with an initial target of 33,060.
Note: The risk level is high.
Note: Trading on CFDs involves risks. Therefore, all scenarios may be possible. This article is not a recommendation to buy or sell but rather an explanatory reading of the price movement on the chart.
| S1: |
 Noor Trends News, Technical Analysis, Educational Tools and Recommendations

