
Mixed trading dominated the movements of the Dow Jones Industrial Average on Wall Street, maintaining the bearish context.
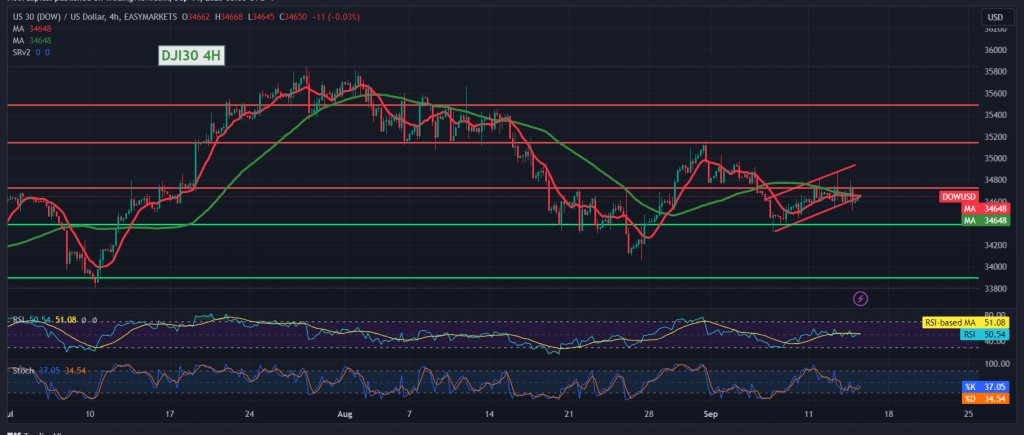
Technically, by looking at the 4-hour time frame chart, the 50-day simple moving average represents an obstacle to attempts to increase the index and the negativity of the Stochastic indicator.
From here, with the price continuing to base itself below the strong resistance level 34,710 and more importantly, 34,730, the bearish bias is the most likely during the day, targeting 34,490 and then 34,365.
From above, the price consolidated again above the pivotal resistance of 34,730, leading the index to recover directly towards 34,810 and 35,00.
Note: Today we are awaiting highly influential economic data issued by the European economy, “the monetary policy statement of the European Central Bank,” “interest rates on the euro and the press conference of the European Central Bank,” and regarding the American economy, we are awaiting the “producer prices” index and the “retail sales” index.
Note: The risk level may be high.
Note: Trading on CFDs involves risks. Therefore, all scenarios may be possible. This article is not a recommendation to buy or sell but rather an explanatory reading of the price movement on the chart.
| S1: |