
Mixed trading characterized the movements of the Dow Jones Industrial Average on Wall Street yesterday, as anticipated, with the Stochastic indicator issuing warning signals that could result in some fluctuation before establishing a definitive direction.
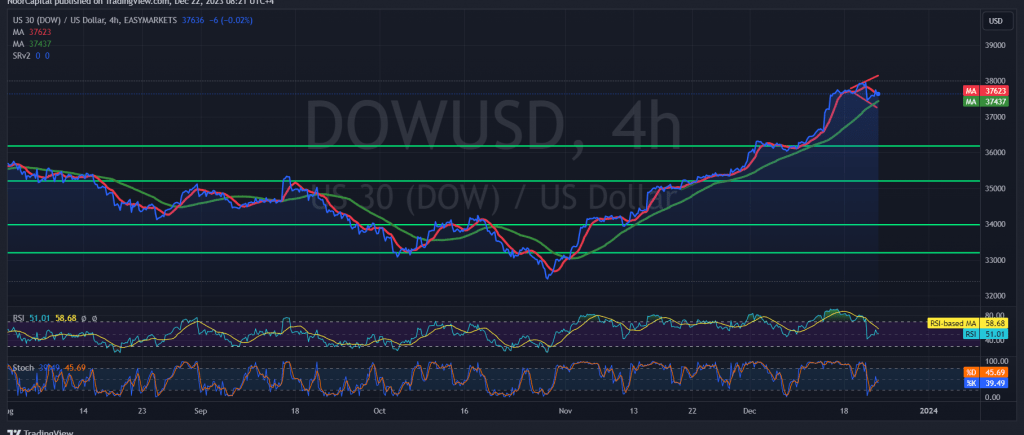
On the technical front today, a closer examination of the 4-hour chart reveals that the Stochastic indicator persists in providing negative signals. Conversely, the simple moving average continues to offer a positive incentive, supporting a potential upward movement.
Despite the overall upward trend, given the conflicting technical signals, we prefer to closely monitor the price behavior of the index, anticipating one of the following scenarios:
- For the continuation of the upward trajectory, confirmation is needed through the consolidation of the index price above 37480. Additionally, a clear and robust breach of the resistance level at 37,780 is required, acting as a motivating factor that facilitates reaching the initial targets of 37,930 and 38,085.
- To establish a bearish bias, breaking below 37,480 is necessary, targeting 37,320 before potential attempts at a subsequent rise.
Warning: Today, high-impact economic data is expected from the American economy, including “annual/monthly core personal consumer spending prices” and “Consumer Confidence” issued by the University of Michigan. Additionally, from the United Kingdom, the release of the “Retail Sales” index, and from the Canadian economy, the monthly GDP indicator is anticipated. Expect heightened price volatility at the time of news release.
Caution: The risk level is high amid ongoing geopolitical tensions, and increased price volatility may be observed.
Note: Trading on CFDs involves risks. Therefore, all scenarios may be possible. This article is not a recommendation to buy or sell but rather an explanatory reading of the price movement on the chart.
| S1: |