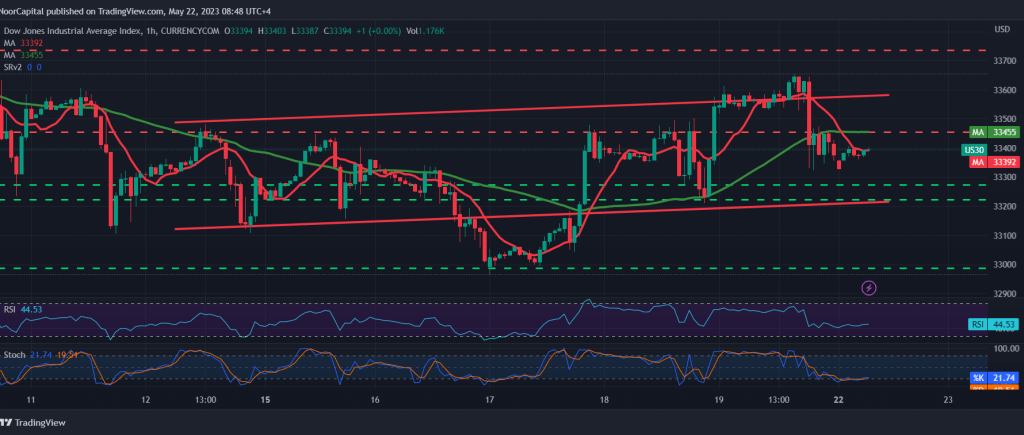
Mixed trading dominated the movements of the Dow Jones Industrial Average on the New York Stock Exchange, and it returned to recording some losses after recording its highest level last Friday, 33656.
Technically, by looking closely at the 4-hour chart, stochastic is trying to provide positive intersection signals to obtain enough momentum to push the index upwards. On the other hand, the simple moving average is still negative, accompanied by the stability of the RSI around neutrality areas.
We prefer to monitor the price behavior of the indicator until we get a stronger trend signal, to be in front of one of the following scenarios:
To get an upward trend, we need to witness a clear and strong breach of the resistance level of 33,440, a catalyst that opens the way towards 33,590.4.
To obtain a bearish trend, this requires confirmation of breaking 33,330, and from here the index is under negative pressure, targeting 33,260 initially.
Note: The level of risk is high.
Note: Trading on CFDs involves risks. Therefore, all scenarios may be possible. This article is not a recommendation to buy or sell but rather an explanatory reading of the price movement on the chart.
| S1: |
 Noor Trends News, Technical Analysis, Educational Tools and Recommendations

