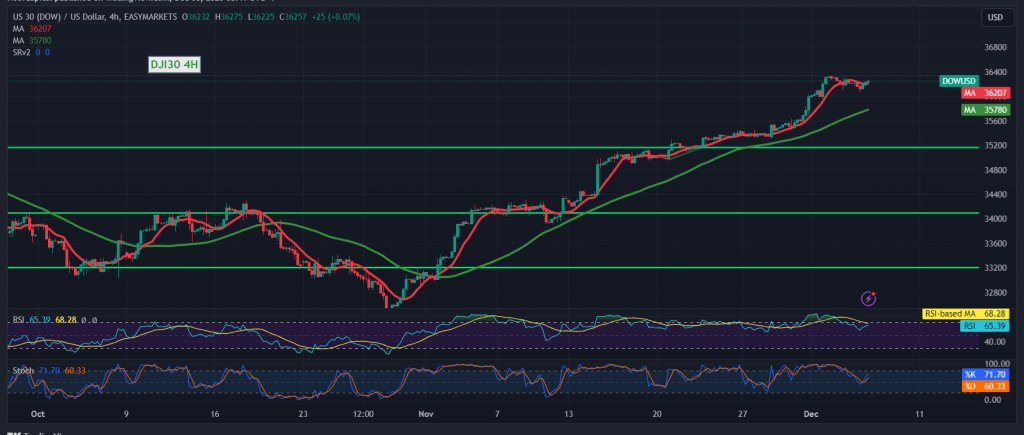
The Dow Jones Industrial Average successfully met the bearish targets outlined in the previous technical report, hitting levels at 36,160 and 36,100, eventually bottoming out at 36,067.
In today’s technical analysis, a detailed examination of the 240-minute time frame chart reveals a notable rebound in response to the return of stability above 36,130. This positive shift is accompanied by a constructive push from the 50-day simple moving average, now working to lift the price from its earlier position below.
Our stance tilts toward positivity, albeit approached with caution. The key criterion for sustained bullish momentum is the price’s ability to consolidate above the resistance level at 36,280. This pivotal factor could serve as a catalyst, potentially bolstering the index’s gains. Initial targets include 36,335, followed by 36,415, with the prospect of further extensions towards 36,540.
Conversely, a return to trading below 36,130 would nullify the activation of the bullish scenario, exerting negative pressure on the index. Downside targets commence at 35,995 and 35,920, respectively.
Investors are urged to exercise prudence today, given the anticipation of high-impact economic data from the American economy, specifically the “change in private non-agricultural sector jobs” from Canada. Additionally, the interest statement and rate decision from the Bank of Canada, coupled with the press talk by the Governor of the Bank of England, may contribute to heightened price fluctuations.
With geopolitical tensions persisting, the risk level remains elevated, prompting a potential surge in price volatility. Traders are advised to stay informed, exercise caution, and remain adaptable in response to dynamic market conditions.
Note: Trading on CFDs involves risks. Therefore, all scenarios may be possible. This article is not a recommendation to buy or sell but rather an explanatory reading of the price movement on the chart.
| S1: |
 Noor Trends News, Technical Analysis, Educational Tools and Recommendations

