
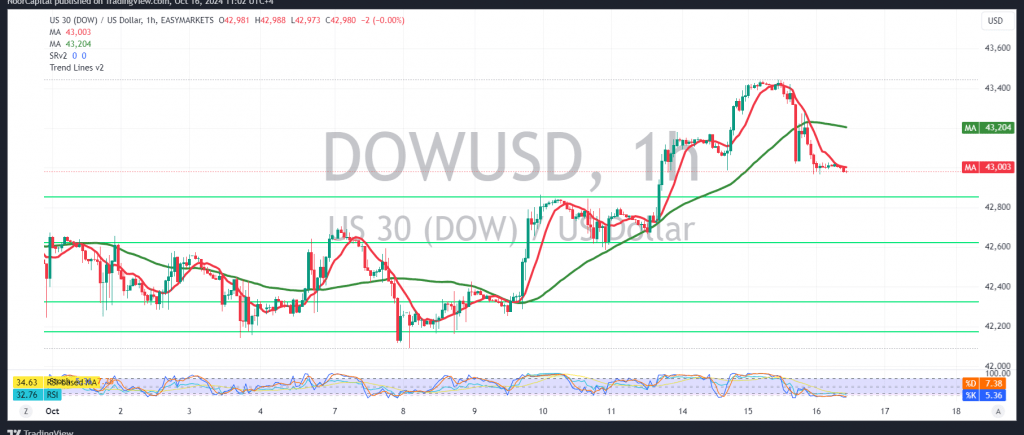
The Dow Jones Industrial Average reversed its upward trend from the previous technical report, reaching a high of 43445 before encountering resistance and trading negatively.
As highlighted earlier, falling below 43120 has put the index under negative pressure. The 60-minute chart shows that the 50-day simple moving average is pressing down on the price, coupled with negative signals from the Relative Strength Index (RSI). Based on these factors, a cautious bearish outlook is favored, with a target of 42830. Breaking below this level could extend losses towards 42660.
However, if trading stabilizes above 43120, and particularly above 43140, the index could regain its upward momentum, potentially reaching 43300 and 43440.
Warning: The risk level is high, and may not be proportional to the expected return. Ongoing geopolitical tensions make all scenarios possible.
Disclaimer: Trading in CFDs carries inherent risks, and all scenarios are possible. This analysis is not investment advice but rather an interpretation of the current technical landscape for the Dow Jones Industrial Average.
| S1: |