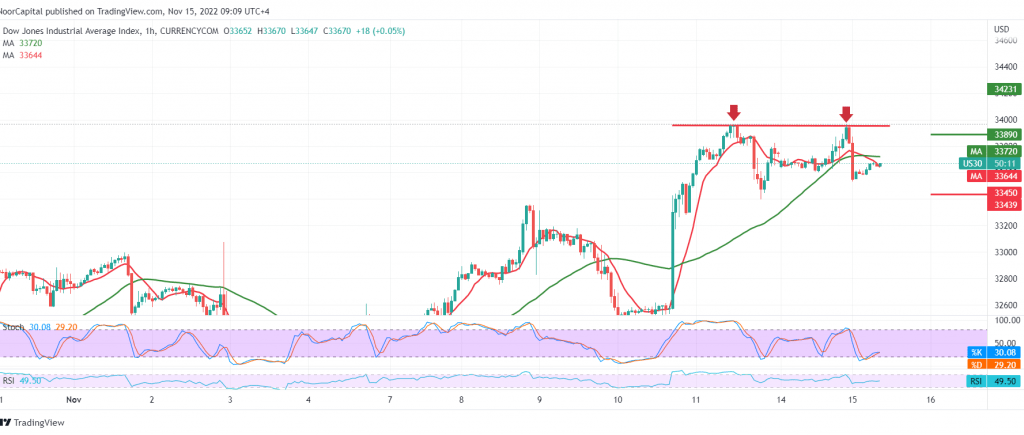
Limited sideways trading dominated the movements of the Dow Jones Industrial Average on Wall Street, as part of the continued attempts to maintain the bullish path.
On the technical side, and carefully considering the 60-minute chart, we find the moving averages starting to pressure the price from above. This comes in conjunction with the stochastic losing the bullish momentum gradually.
In the coming hours, we may witness a bearish tendency, targeting 33,560 first target. Breaking it puts the index under negative pressure and may extend losses to visit 33,470 before attempting to rise again.
Note: Monthly US inflation data is due today in “Product Price Index”, and we may witness clear price fluctuations.
Note: Trading on CFDs involves risks. Therefore, all scenarios may be possible. This article is not a recommendation to buy or sell but rather an explanatory reading of the price movement on the chart.
| S1: |
 Noor Trends News, Technical Analysis, Educational Tools and Recommendations

