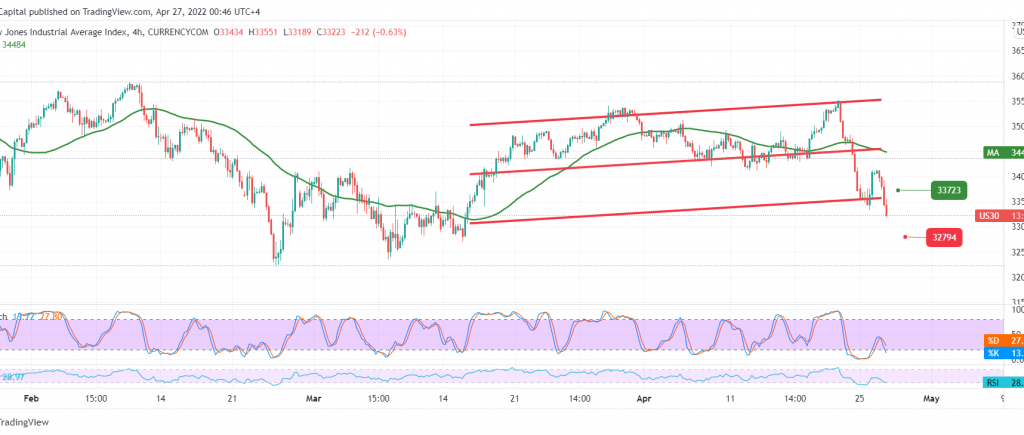
Negative trading dominates the Dow Jones Industrial Average movements in the New York Stock Exchange, giving up its recent gains to reach its lowest level at 33,090.
On the technical side today, and with careful consideration on the 60-minute chart, we find that the RSI continues to defend the bearish trend, stable below the 50 mid-line, in addition to the negative pressure formed by the 50-day moving average.
Therefore, the bearish scenario may be the most likely, provided we witness a clear and strong break of the 33,090 support level, targeting 32,800 initial price stations. Bearish targets may extend later to visit 32,470 as long as possible the price is stable below 33,750.
Note: Trading on CFDs involves risks. Therefore, all scenarios may be possible. This article is not a recommendation to buy or sell but rather an explanatory reading of the price movement on the chart.
| S1: |
 Noor Trends News, Technical Analysis, Educational Tools and Recommendations

