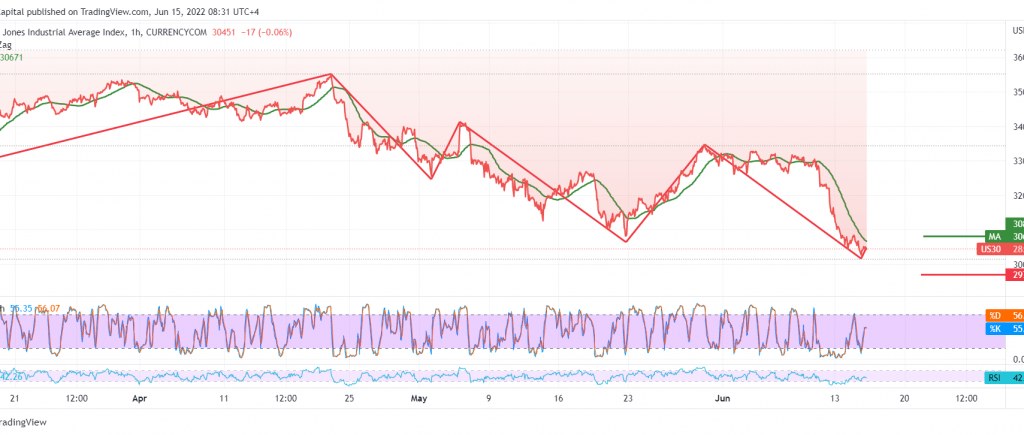
Wall Street witnessed heavy losses within the expected bearish movement of American stocks, as the Dow Jones Industrial Average recorded a decline of more than 0.5% around 30,136.
Technically, and by looking at the 60-minute chart, we find that the RSI continues to defend the bearish trend, stable below the mid-line 50, and the negative pressure comes from the simple moving averages.
From here, and with the price pivot below 30,830, the bearish scenario is still intact, knowing that a decline below 30,400 facilitates the task required to visit 30,095 initial stations and break it, forcing the index to complete the descending wave towards 29,750 as long as the price is stable below 30,830 and stepping up to it leads the index to temporary recovery to visit 31,200.
Note: the level of risk is high.
Note: the markets are waiting for important data that could lead to volatility; US Retail Sales, Interest Rate, Federal Reserve Statement & Press Conference
Note: Trading on CFDs involves risks. Therefore, all scenarios may be possible. This article is not a recommendation to buy or sell but rather an explanatory reading of the price movement on the chart.
| S1: |
 Noor Trends News, Technical Analysis, Educational Tools and Recommendations

