
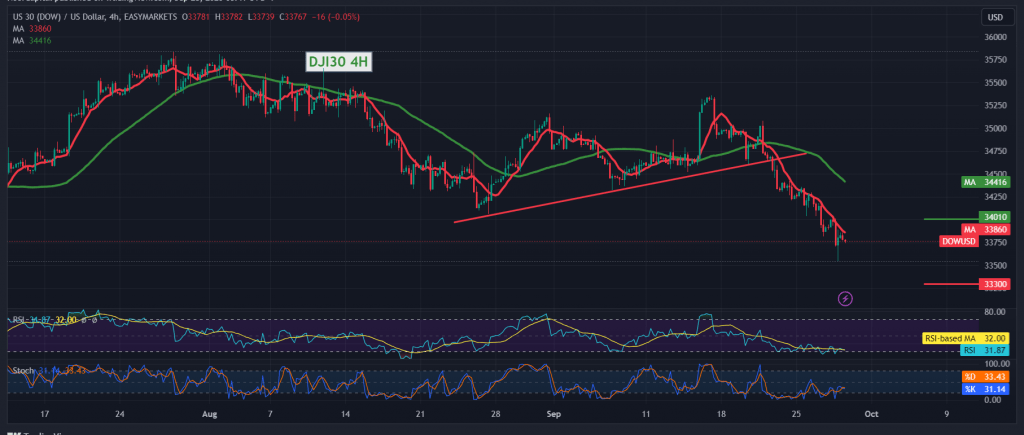
Strong negative trading witnessed the movements of the Dow Jones Industrial Average on the Wall Street Stock Exchange amid strong selling operations within the expected downward trend during the previous report, touching the official target of 33,610, recording its lowest level of 33,545.
On the technical side today, the simple moving averages continue to pressure the price from above and support the continuation of the downward directional movement, in addition to the negative signals from the relative strength index.
From here, with daily trading remaining below the 34,000 resistance level, the downward trend is the most likely, targeting 33,530 as the first target, knowing that breaking the aforementioned level extends the index’s losses, directly opening the door to visit 33,310.
The price’s consolidation again above 34,000 can temporarily thwart the bearish scenario and lead the index to retest 34,240.
Note: Today we are awaiting high-impact economic data issued by the American economy, the final reading of the gross domestic product and Federal Reserve Chairman Jerome Powell speech, and we may witness high price volatility.”
Note: Trading on CFDs involves risks. Therefore, all scenarios may be possible. This article is not a recommendation to buy or sell but rather an explanatory reading of the price movement on the chart.
| S1: |