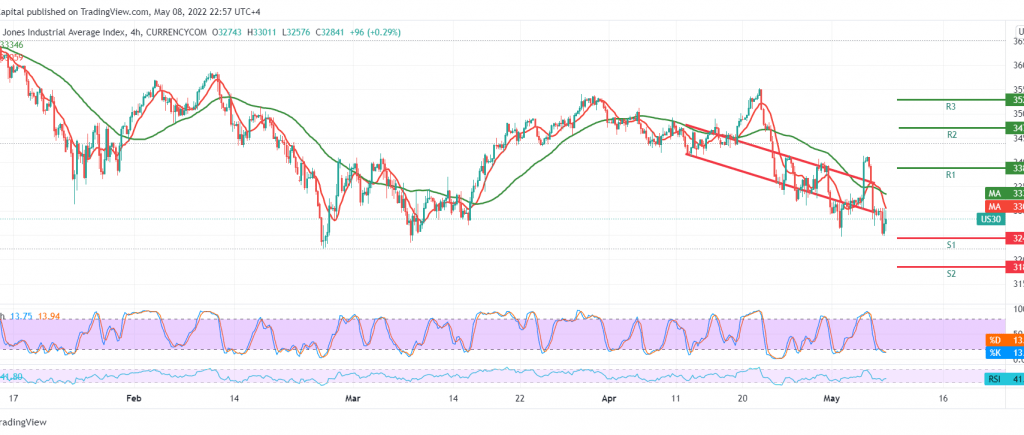
The negative pressure continues on the Dow Jones Industrial Average within the expected bearish path, leading the index to touch the first target required to be achieved at 32,440, recording its lowest level at 32,374.
Technically, by looking at the 60-minute chart, we find that the RSI continues to defend the daily bearish trend and the price’s pivot below the 33,000 resistance level and, most importantly 33,065.
Therefore, we tend to the negativity, knowing that trading below 32,465 extends the index’s losses to visit 32,375, knowing that the decline increases the strength of the daily bearish trend, to be waiting for the next station 32,125 as long as the trades are stable below 33,065.
Consolidation and stability above 33,065 might stop the daily bearish trend and start the indicator temporarily recovering towards 33,300.
Note: the level of risk may be high.
Note: Trading on CFDs involves risks. Therefore, all scenarios may be possible. This article is not a recommendation to buy or sell but rather an explanatory reading of the price movement on the chart.
| S1: |
 Noor Trends News, Technical Analysis, Educational Tools and Recommendations

