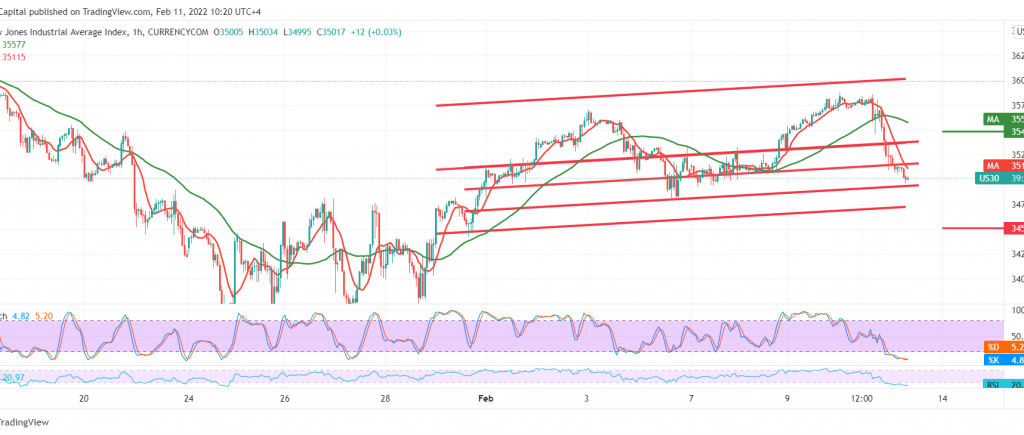
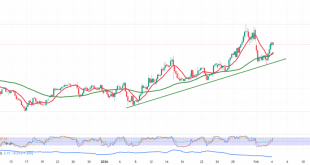
The Dow Jones Industrial Average declined significantly to give up its recent gains. During the previous session, it recorded its highest level at 35,748, recording its lowest price at 34,852.
On the technical side today, and carefully considering the 60-minute chart, we find that the index achieved a pivot below the level of 35,370. Furthermore, we find that the RSI is stable below the 50 mid-line, accompanied by the negative pressure of the 50-day moving average.
There may be a possibility of further decline to visit 34,650 initial stations, knowing that the decline below the target level extends the index’s losses to visit 34,595 next stations that may extend later to visit 34,500.
Consolidation above 35,370 may postpone the decline and lead the index to reduce its losses to visit 35,490.
Note: The risk level is high.
Note: CFD trading involves high risk; all scenarios may occur.
| S1: 34595 | R1: 35495 |
| S2: 34275 | R2: 36070 |
| S3: 33700 | R3: 36390 |
 Noor Trends News, Technical Analysis, Educational Tools and Recommendations

