
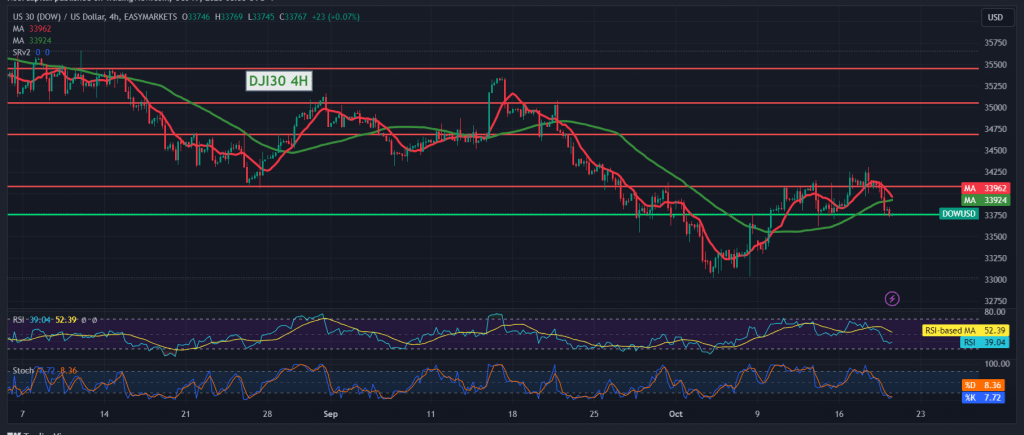
The Dow Jones Industrial Average suffered major losses on Wall Street yesterday after it failed to maintain positive stability above the support level of 34,040. Explaining that breaking the level above places the index under negative pressure, it aimed to retest 33,965 and recorded its lowest level of 33,722.
On the technical side today, with a closer look at the 4-hour chart, we find a negative intersection of the simple moving averages and clear negative signals on the 14-day momentum indicator.
With intraday trading remaining below 34,000, the downward trend is preferable, with the first target at 33,610. Losses may extend later towards 33,450 unless we witness any trading above 34,000, and most importantly 34,030.
Only the return of trading stability above 34,030 will immediately stop the downward trend, and the index will return to the official upward path with a target of 34,300.
Note: Trading on CFDs involves risks. Therefore, all scenarios may be possible. This article is not a recommendation to buy or sell but rather an explanatory reading of the price movement on the chart.
| S1: |