
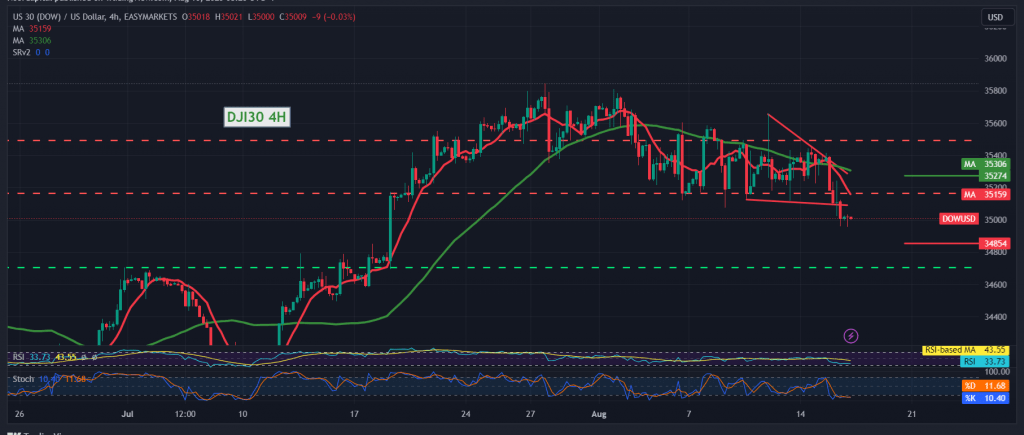
We adhered to intraday neutrality during the previous technical report, explaining that we are waiting for the pending orders to be activated, and we indicated that the index price infiltration below 35,100 puts the index under strong negative pressure; its first target is 35,020, recording its lowest level at 34,957.
On the technical side today, and with a closer look at the 4-hour chart, we find that the simple moving averages continue to exert negative pressure on the price from above, stimulated by a decline in the clear momentum on the 14-day momentum indicator.
From here, with the stability of intraday trading below 35,100, the bearish bias remains the most likely, but with caution, targeting 34,840 as a first target, bearing in mind that confirming the breach of the mentioned level increases and accelerates the strength of the bearish bias, opening the door to visit 34,680.
Only from above, skipping upwards above 35,100, and then 35,275, will immediately stop the suggested scenario and lead the index to recover, heading towards 35,555.
Note: Today we are awaiting high-impact economic data issued by the US economy, “the results of the Federal Reserve Committee meeting,” and we may witness high price volatility.
Note: the risk level may be high.
Note: Trading on CFDs involves risks. Therefore, all scenarios may be possible. This article is not a recommendation to buy or sell but rather an explanatory reading of the price movement on the chart.
| S1: |