
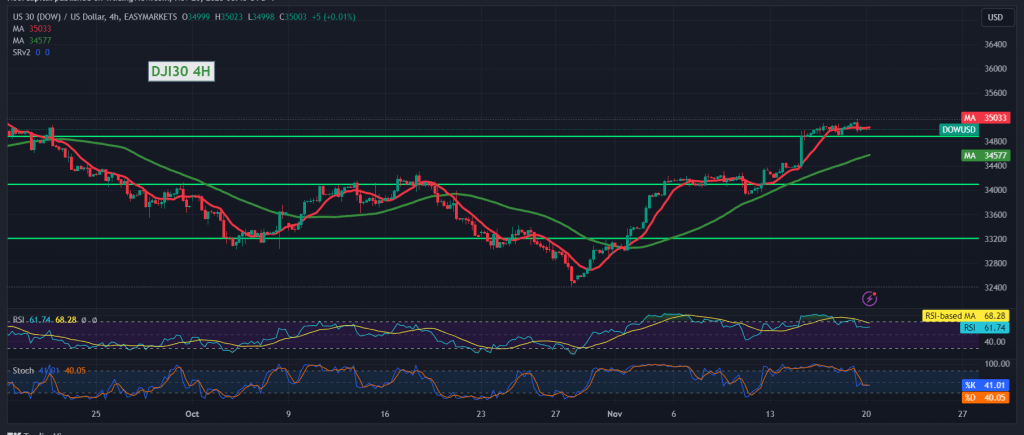
Positive trading prevailed in the movements of the Dow Jones Industrial Average on the Wall Street Stock Exchange during the last trading session, reaching the initial official target at the price of 35145 and achieving its highest level at 35167.
From a technical standpoint today, the outlook leans towards positivity, supported by the indicator’s continued receipt of positive signals from the simple moving averages. These signals align with the positive indications from the Relative Strength Index (RSI). However, momentary negative signals on the Stochastic indicator suggest the possibility of a temporary bearish tendency in the coming hours. This might lead to a retracement, testing the support around 34890 before a potential resumption of the upward movement.
It’s important to note that this temporary bearish tendency does not contradict the overall daily upward trend, with targets located around 35130. A breach of this level could further enhance gains, with an anticipated target at 35260.
On the flip side, a drop below 34900 could delay upward attempts and exert negative pressure on the index, potentially leading to a retest of 34800.
Caution is advised: The current geopolitical tensions heighten the risk level significantly, potentially resulting in increased price volatility. Investors should remain vigilant and exercise caution in response to market dynamics.
Note: Trading on CFDs involves risks. Therefore, all scenarios may be possible. This article is not a recommendation to buy or sell but rather an explanatory reading of the price movement on the chart.
| S1: |