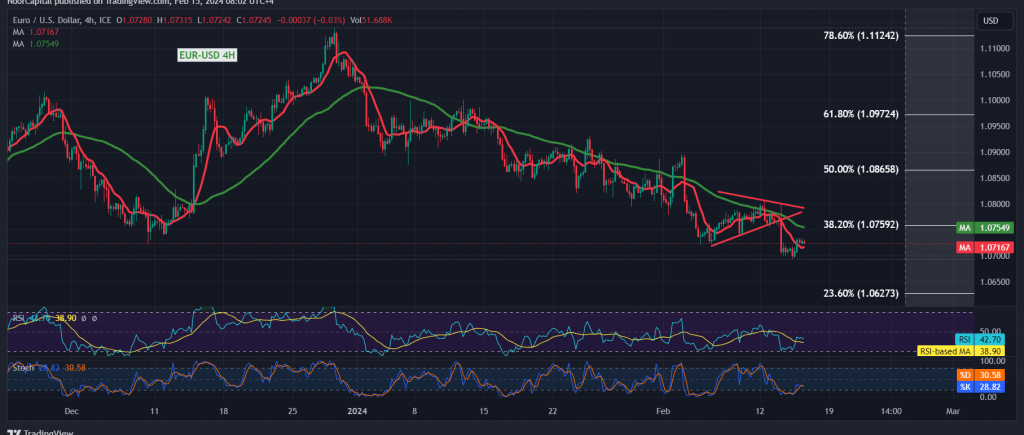
The Euro/Dollar pair held steady with a negative bias, maintaining its stability within a tight range. In the previous trading session, the pair exhibited a slight bearish trend, reaching its lowest point at 1.0695.
Technical Analysis:
Upon closer examination of the 4-hour timeframe chart, the pair remains stable below the broken support level of 1.0760, marked by the 38.20% Fibonacci retracement. This level has now transformed into a resistance level, adding to the negative pressure on the pair. Additionally, the simple moving averages are exerting downward pressure from above, signaling a clear bearish sentiment. The Stochastic indicator continues to show signs of losing momentum.
Potential Bearish Scenario:
Given the current technical setup, the possibility of a continued decline remains significant. A breach below the 1.0700 level could extend the pair’s losses, targeting 1.0675 initially, followed by 1.0635 as the next key support level. Further downside momentum may lead the pair towards 1.0575.
Bullish Reversal Scenario:
However, a reversal scenario could materialize if the pair manages to jump above 1.0775 and consolidates its price above this level. Such a move would invalidate the bearish outlook and pave the way for a potential recovery towards 1.0800 and 1.0835, respectively. Continued gains could see the pair targeting 1.0860, corresponding to the 50.0% Fibonacci retracement level.
Caution Ahead of High-Impact Economic Data:
Traders should exercise caution as high-impact economic data is expected to be released today, particularly from the British and United States economies. Key data points include the monthly gross domestic product from the UK and monthly retail sales, unemployment benefits, and the New York State manufacturing index from the US. These releases may trigger significant price fluctuations in the currency markets.
Note: Trading on CFDs involves risks. Therefore, all scenarios may be possible. This article is not a recommendation to buy or sell but rather an explanatory reading of the price movement on the chart.
| S1: |
 Noor Trends News, Technical Analysis, Educational Tools and Recommendations

