
During the previous trading session, gold prices experienced subdued movements, remaining within the anticipated bearish corrective trajectory outlined in the preceding technical report. The precious metal recorded its lowest level at $1984 per ounce.
Technical Analysis Insights:
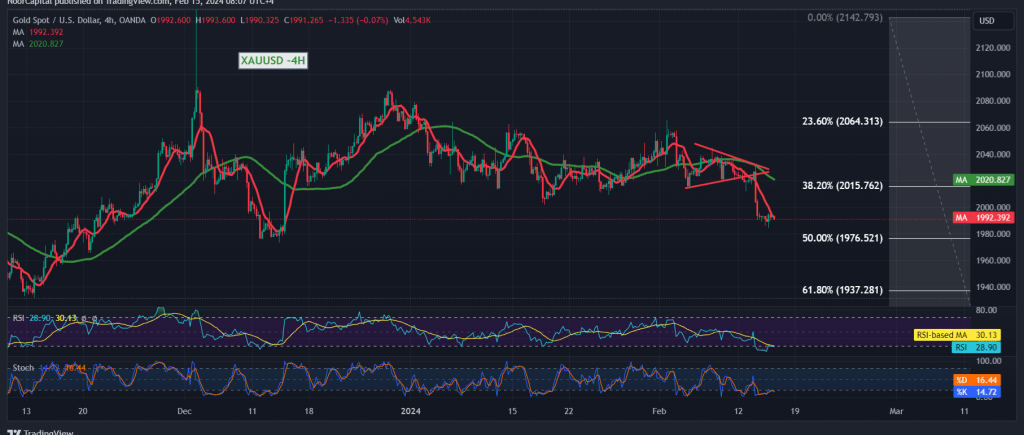
Analyzing the 4-hour timeframe chart, gold prices have notably breached a crucial support level established in 2016, positioned at the 38.20% Fibonacci retracement. This level has now transitioned into a resistance barrier, further solidifying the bearish sentiment. Additionally, the simple moving averages have intersected negatively, reinforcing the continuation of the downward trend.
Potential Downward Trajectory:
Given the prevailing technical setup, the downward trajectory appears poised to persist, targeting the next significant support level at 1977, corresponding to the 50.0% correction level. A breach below this level could intensify and accelerate the strength of the downward trend, potentially leading to a further decline towards 1937.
Caution Amidst Key Levels:
It is imperative to closely monitor the 1977 level, as its breach would signify increased bearish momentum. However, it’s worth noting that a return to trading stability above the psychological barrier of $2000 may temporarily postpone the likelihood of a decline. Nevertheless, such a move does not completely eliminate the possibility, and we may witness temporary recovery attempts aimed at retesting the 2016 resistance level before resuming the downward trajectory.
Warnings and Cautionary Notes:
Investors should exercise caution, particularly as the Stochastic indicator hovers around oversold areas, suggesting a potential reversal or pause in the downward movement. Additionally, high-impact economic data releases from both the British and United States economies, including monthly gross domestic product and retail sales figures, along with unemployment benefits and the New York State manufacturing index, could lead to heightened price volatility upon their release. Traders should remain vigilant and be prepared for significant fluctuations in gold prices in response to these economic indicators.
Note: Trading on CFDs involves risks. Therefore, all scenarios may be possible. This article is not a recommendation to buy or sell but rather an explanatory reading of the price movement on the chart
| S1: |