US Crude Oil Futures Reach Target Before Facing Resistance
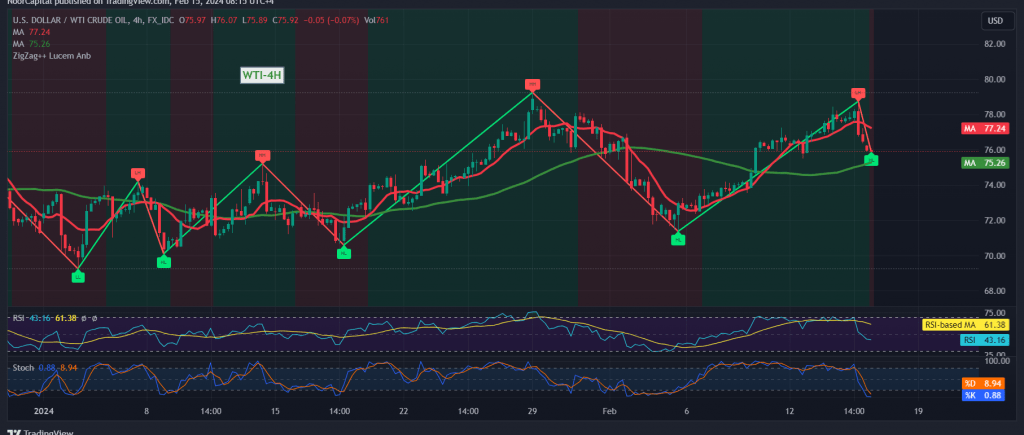
US crude oil futures prices surged to achieve the initial upward target as anticipated in the previous technical report, hitting a peak of $78.74 per barrel, surpassing the first milestone at $78.55.
Technical Analysis Highlights:
During the trading session, oil prices encountered formidable resistance around the $78.50 mark, exerting downward pressure on the commodity. This resistance level acted as a significant barrier, prompting a decline in oil prices. As trading commenced today, a downward price gap was observed. A closer examination of the 4-hour timeframe chart reveals that the relative strength index (RSI) has begun to provide negative signals, signaling a decline in upward momentum. Furthermore, intraday trading has remained below the key resistance level of $77.80.
Potential Bearish Bias Ahead:
Given the current technical indicators, there exists a possibility of a bearish bias in the upcoming hours. A breach below the $75.50 support level could amplify negative pressure, potentially leading to a retest of $75.00, with further losses extending towards $74.60.
Reversal Scenario:
Conversely, a return to trading stability above the $77.80 resistance level would halt the bearish scenario, prompting oil prices to resume their upward trajectory. In such a scenario, the commodity could aim for targets at $79.70 and $80.40, respectively.
Warnings Amid Economic Data Releases and Geopolitical Tensions:
Investors should exercise caution, particularly with high-impact economic data releases scheduled from both the British and United States economies, including monthly gross domestic product, retail sales figures, unemployment benefits, and the New York State manufacturing index. The release of these economic indicators could lead to increased price fluctuations. Moreover, ongoing geopolitical tensions may contribute to heightened price volatility in the oil market, necessitating careful risk management strategies.
Note: Trading on CFDs involves risks. Therefore, all scenarios may be possible. This article is not a recommendation to buy or sell but rather an explanatory reading of the price movement on the chart.
| S1: |
 Noor Trends News, Technical Analysis, Educational Tools and Recommendations

