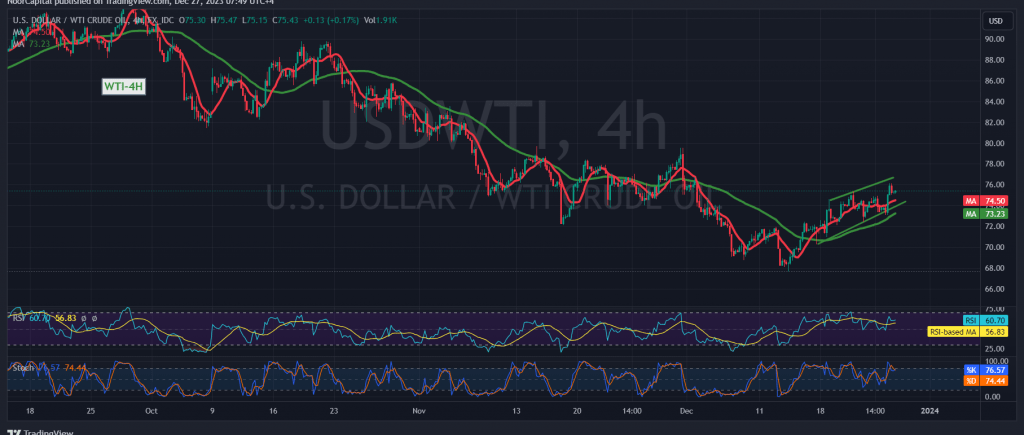
US crude oil futures exhibited a significant uptrend in the previous trading session, leveraging robust support around $73.20 and reaching a peak of $76.14 per barrel. Technical indicators, including the positive alignment of simple moving averages and encouraging signals from the Relative Strength Index (RSI), contribute to the optimistic outlook.
Technical Analysis Overview: The positive intersection of simple moving averages bolsters the case for rising opportunities in US crude oil futures. Concurrently, the RSI maintains stability above the midline on short time intervals, underscoring the strength of the current bullish momentum.
Intraday Scenario: With intraday trading holding above $73.70 and maintaining a general position above $73.20, the bullish scenario retains validity. The initial target is set at $76.65, with the potential for further gains upon breaching this level, opening the path to $77.85 as the official target.
Risk Considerations: A pivotal factor in the bullish narrative is the necessity for trading stability above $73.20, and particularly, remaining above $73.70. Any decline below $73.20, accompanied by the closure of an hourly candle, may halt the proposed bullish scenario and introduce negative pressure on oil prices, with downside targets commencing at $72.00.
Risk Warning: The risk level is deemed high, given ongoing geopolitical tensions, and the potential for heightened price volatility. Traders are cautioned to exercise vigilance and implement prudent risk management strategies.
Conclusion: US crude oil futures showcase a robust bullish trend, supported by technical indicators. Traders should closely monitor key support and resistance levels, with a focus on the $73.20 threshold. While the bullish scenario remains intact, market participants are advised to stay alert to geopolitical developments, which may influence oil prices and contribute to increased volatility.
Note: Trading on CFDs involves risks. Therefore, all scenarios may be possible. This article is not a recommendation to buy or sell but rather an explanatory reading of the price movement on the chart.
| S1: |
 Noor Trends News, Technical Analysis, Educational Tools and Recommendations

