
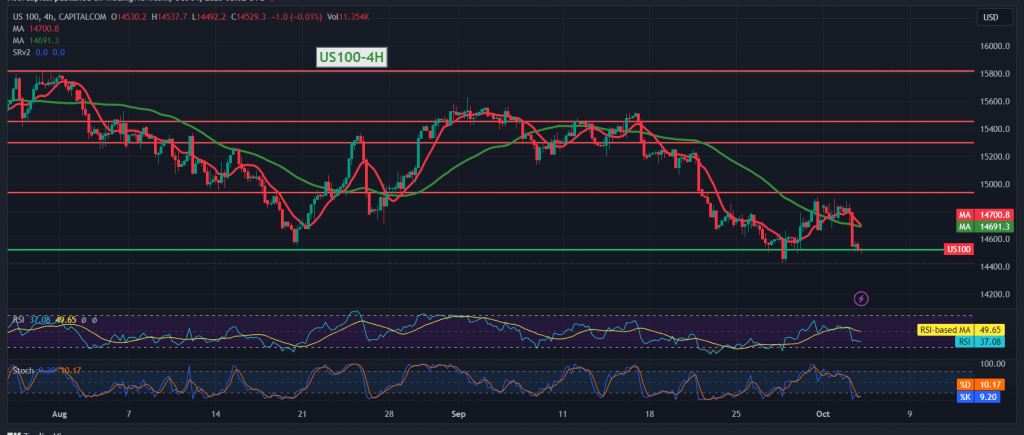
We remained neutral for the moment during the previous report due to the conflicting technical signals, explaining that activating the selling positions requires that we witness a break of the support floor of 14,720, targeting 14,695 as the first target and then 14,580, so that the index records its lowest level at 14,492.
On the technical side today, with a closer look at the 4-hour chart, we find the simple moving averages continuing to pressure the price from above, accompanied by clear negative signs on the Relative Strength Index and its stability below the 50 midline.
Therefore, the downward trend is the most preferred during today’s trading, targeting 14,380 as the first target; knowing that breaking the target level enhances the chances of continuing the decline, we are waiting for 14,425.
From the top, crossing upwards and the price consolidating above 14,765 will immediately stop the expected scenario, and the index will recover temporarily with a target of 15,010.
Note: Today we are awaiting high-impact economic data issued by the US economy: the change in private sector jobs, the services purchasing managers’ index issued by the ISM, the meeting of the OPEC Joint Ministerial Follow-up Committee, and the speech of Christina Lagarde, President of the European Central Bank, and we may witness high volatility at the time of the news release.
Note: Trading on CFDs involves risks. Therefore, all scenarios may be possible. This article is not a recommendation to buy or sell but rather an explanatory reading of the price movement on the chart.
| S1: |