
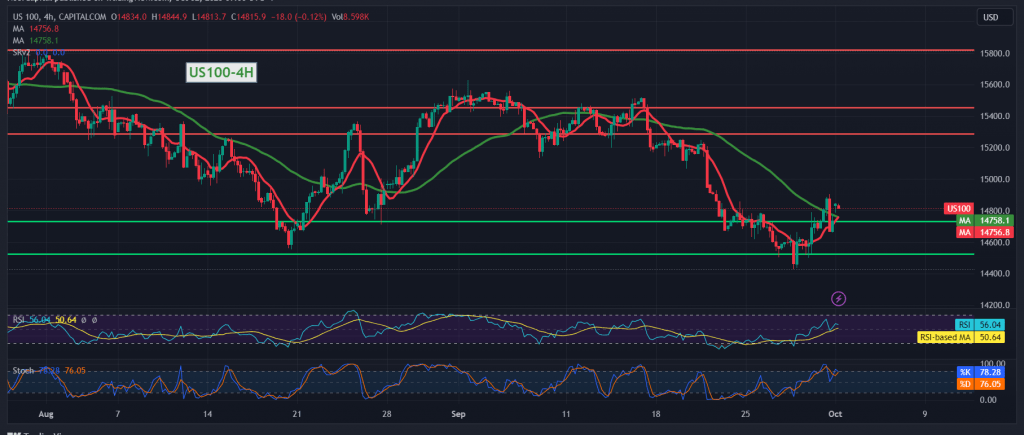
Positive trading dominated the movements of the Nasdaq index at the end of last week’s trading, touching the desired target of 14,845, recording its highest level of 14,903.
On the technical side today, by looking at the 4-hour time frame chart, we find the 14-day momentum indicator providing positive signals and the stability of the positive momentum coming from the 50-day simple moving average.
From here, with the stability of intraday trading above 14,730, there may be a possibility of an upward trend occurring, knowing that the jump upwards and the price’s consolidation above 14,900 is a motivating factor that enhances the chances of a rise to visit 14,930 as a first target. The gains may extend later towards 15,040 initially.
Trading stability and price consolidation below 14,730 will immediately stop the proposed bullish scenario and lead the index to retest 14,685 and 14,630.
Note: Today, we are awaiting high-impact economic data issued by the US economy, the Manufacturing Purchasing Managers’ Index, and the speech of Federal Reserve Chairman Jerome Powell, and we may witness high price fluctuations.
Note: Trading on CFDs involves risks. Therefore, all scenarios may be possible. This article is not a recommendation to buy or sell but rather an explanatory reading of the price movement on the chart.
| S1: |