
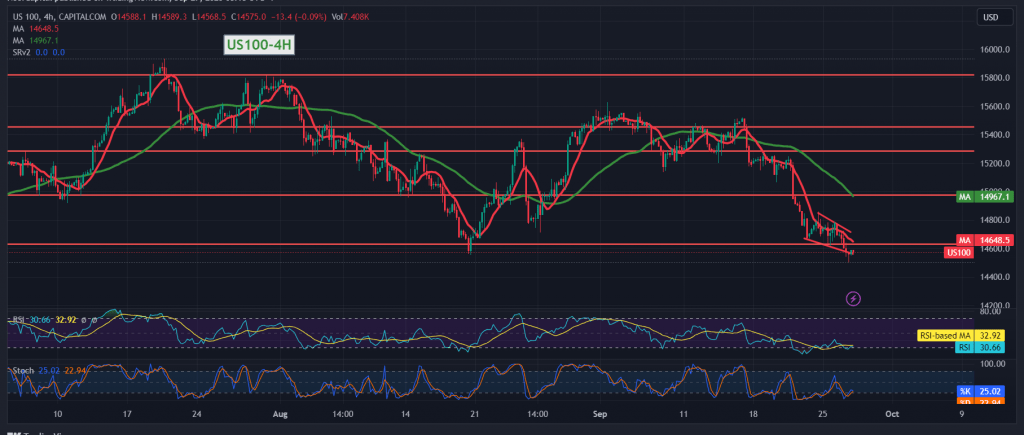
A strong downward trend dominated the performance of the Nasdaq index during the previous trading session, within the expected downward trend during the previous report, touching the official target of 14,540, recording its lowest level of 14,504.
On the technical side today, with a closer look at the 4-hour chart, negative pressure still comes from the simple moving averages and negative signals on the Stochastic indicator.
Hence, with the stability of intraday trading below the resistance level of 14630, and most importantly, 14,730, the bearish scenario remains the most preferable during today’s trading session, targeting 14,460 and breaking the aforementioned level extends the index’s losses, as we wait for 14340.
Trading stability and price consolidation above 14,730 will immediately stop the proposed bearish scenario and lead the index to retest 14895 and then 15,010.
Note: Trading on CFDs involves risks. Therefore, all scenarios may be possible. This article is not a recommendation to buy or sell but rather an explanatory reading of the price movement on the chart.
| S1: |