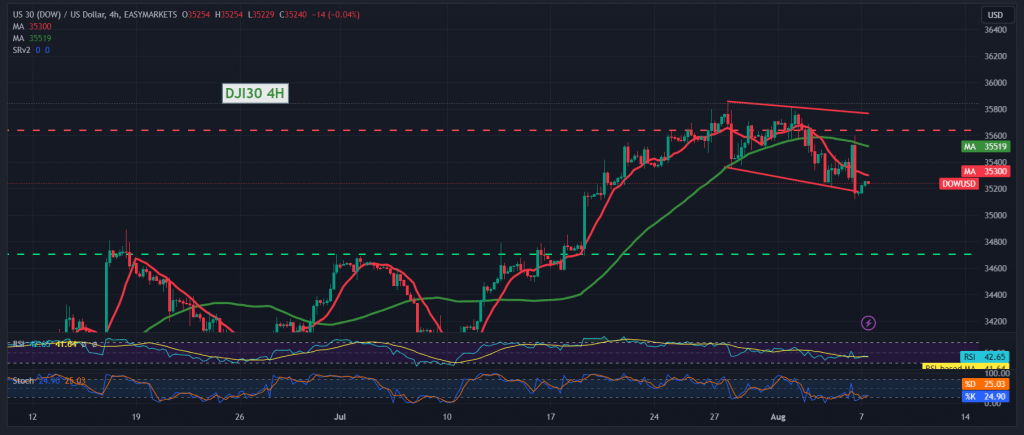
Mixed trading dominated the movements of the Dow Jones Industrial Average on the New York Stock Exchange at the end of last week’s trading, to conclude its weekly dealings around 35,177.
On the technical side today, looking at the 240-minute chart, the Simple Moving Averages are starting to pressure the price from above, accompanied by signs of declining momentum on the short time frames.
We may witness a bearish trend during the coming hours, with trading steady at 35,310, targeting 35,120 first, and breaking it will facilitate the task required to visit 35,030 next.
Closing an hourly candlestick above 35,310 can thwart the suggested scenario and lead the index to the official bullish path again, as we are waiting to touch 35,515.
Note: the risk level may be high.
Note: Trading on CFDs involves risks. Therefore, all scenarios may be possible. This article is not a recommendation to buy or sell but rather an explanatory reading of the price movement on the chart.
| S1: |
 Noor Trends News, Technical Analysis, Educational Tools and Recommendations

