
Gold (XAU/USD) Technical Analysis
Gold prices came under intense selling pressure after running into the pivotal $4,220 resistance highlighted in our previous technical report. The level successfully curbed the upside attempts and propelled prices into a swift decline, reaching the projected target at $4,129 before printing an early-trading low of $4,114 per ounce.
Technical Outlook – 4-Hour Timeframe:
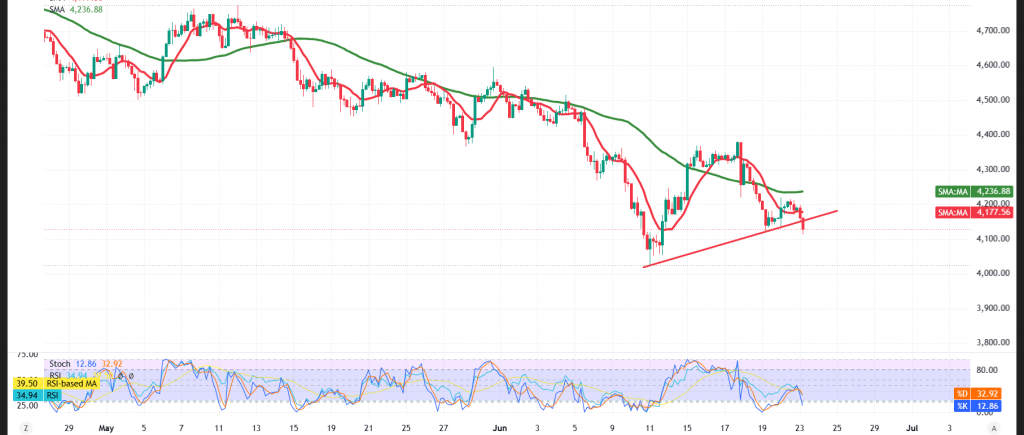
With respect to intraday dynamics, the Relative Strength Index (RSI) continues to broadcast clear negative signals despite its positioning within oversold territory — a configuration that mirrors the persistent weakness in buying momentum and the inability of buyers to reassert control thus far.
On the flip side, prices remain anchored beneath the simple moving averages, which continue to function as robust dynamic resistance barriers — a configuration that preserves the bearish bias and frames any current upside attempts as nothing more than temporary technical corrections, unless the key resistance levels are decisively breached and sustained above.
Taken as a whole, the technical outlook remains negative over the short term as long as trading holds beneath the key resistance levels.
Bearish (Most Likely) Scenario:
Sustained trading beneath the $4,195 resistance ceiling preserves the bearish bias, with the initial target set at:
- $4,087
A decisive break below this level — coupled with sustained trading beneath it — would accelerate the decline toward:
- $4,045 as the subsequent objective
Bullish Scenario:
This scenario would only be validated should gold deliver a decisive breakout above the $4,195 resistance and sustain trading above it — a development that would supply prices with the opportunity to mount a technical rebound, with targets set at:
- $4,220 as the initial objective
- Followed by $4,260 as the subsequent level
Disclaimer: Trading gold carries substantial risk and may not be suitable for all investors.
Risk Disclaimer: Trading CFDs involves risks, and therefore all scenarios may be plausible. The content above is not a recommendation to sell or buy but rather an explanatory reading of price movement on the chart.
| S1: 4087.00 | R1: 4193.00 |
| S2: 4045.00 | R2: 4260.00 |
| S3: 3981.00 | R3: 4300.00 |


