
EUR/USD Technical Analysis
The 1.1480 resistance level outlined in our previous technical report successfully capped the upside attempts, propelling the EUR/USD pair into a fresh downside wave. The pair gradually approached the projected target at 1.1380, printing a morning-session low of 1.1419.
Technical Outlook – 4-Hour Timeframe:
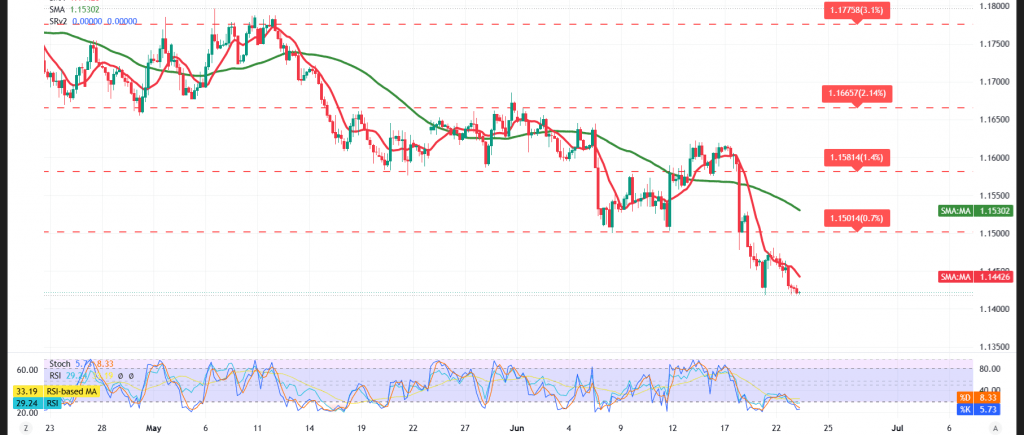
With respect to intraday dynamics, the pair continues to trade beneath the 50-period simple moving average (SMA), which continues to function as a dynamic resistance barrier — a configuration that mirrors the dominance of the downtrend and preserves the negative pressure intact over the short term.
On the flip side, the Relative Strength Index (RSI) has started to display initial positive signals that could help mitigate the current decline and raise the prospects of a temporary technical rebound. That said, these signals remain insufficient to reverse the broader downtrend.
Taken as a whole, the technical outlook remains negative as long as trading holds beneath the key resistance levels, with sellers retaining the upper hand over the short term.
Expected Scenarios:
Bearish (Most Likely) Scenario:
Sustained trading beneath the 1.1460 resistance ceiling keeps the prospects of a resumption of the downtrend firmly on the table — particularly should the price succeed in breaching the 1.1420 support and sustain trading below it — with targets set at:
- 1.1380 as the initial objective
- Followed by 1.1350 as the subsequent target
Bullish Scenario:
Conversely, should the pair manage to close above the 1.1460 level — and more critically above 1.1480 — on at least one hourly candle, the bearish scenario could be temporarily postponed, raising the prospects of a retest of:
- 1.1545 as the initial upside target
- Risk Disclaimer: Trading CFDs involves risks, and therefore the scenarios outlined above are not a recommendation to sell or buy but rather an explanatory reading of price movement on the chart.
| S1: 1.1380 | R1: 1.1460 |
| S2: 1.1350 | R2: 1.1505 |
| S3: 1.1305 | R3: 1.1545 |


