
Gold (XAU/USD) Technical Analysis
Gold prices (XAU/USD) retreated during the previous session after failing to sustain trading above the $4,600 mark, sliding to an intraday low of $4,510 — a move that underscores the persistence of selling pressure on the metal.
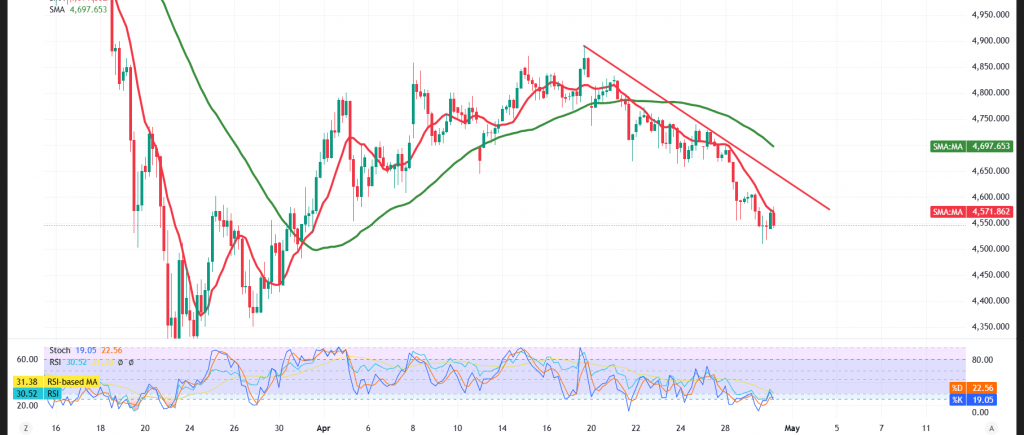
Technical Outlook – 4-Hour Timeframe:
In the short term, the price is staging a tentative recovery attempt, supported by the Relative Strength Index (RSI) dipping into oversold territory — a condition that could help temper the pace of the decline over the near term.
That said, the simple moving averages continue to maintain a bearish crossover from above, exerting dynamic resistance on the price. This dynamic, combined with the metal’s movement within a descending channel/trendline structure, lends further weight to the bearish scenario.
Trading below the $4,600 threshold — which has now flipped from support into resistance under the principle of role reversal — preserves the bearish bias, provided the $4,500 floor is decisively breached. In such a case, the price could extend its decline toward:
- $4,455 as the initial downside target
On the flip side, should the price successfully defend the $4,500 support and reclaim the $4,600 level, this would likely arrest the downtrend and pave the way for a corrective rebound targeting:
- $4,654 as the initial upside target
- Followed by $4,695 as the subsequent objective
Key Economic Events to Watch:
Today’s session features a heavy slate of high-impact economic releases from major economies, which are expected to materially influence market dynamics:
🇬🇧 United Kingdom:
- Interest Rate Decision
- Bank of England Monetary Policy Statement
- MPC Official Bank Rate Vote
🇪🇺 Eurozone:
- European Central Bank Monetary Policy Statement
- ECB Press Conference
🇺🇸 United States:
- Core PCE Price Index
- Advance GDP (Quarterly)
Disclaimer: Trading gold carries substantial risk and may not be suitable for all investors.
Risk Alert: Risk levels remain elevated amid persistent trade frictions and geopolitical tensions — all scenarios should be considered plausible.
Risk Disclaimer: Trading CFDs involves risks, and therefore all scenarios may be plausible. The content above is not a recommendation to sell or buy but rather an explanatory reading of price movement on the chart.
| S1: 4498.00 | R1: 4600.00 |
| S2: 4455.00 | R2: 4654.00 |
| S3: 4398.00 | R3: 4698.00 |


