
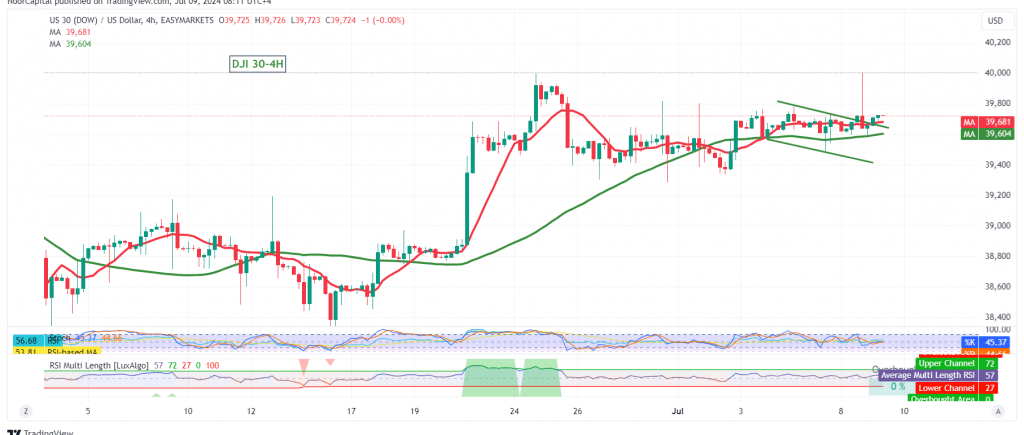
The Dow Jones Industrial Average (DJIA) experienced mixed movements in the first trading session of the week, reaching a high of 40007 before retracing lower. Technical analysis suggests a cautious optimistic outlook, but with potential for significant volatility.
Key Technical Signals:
- Support Level: The index is currently holding above the crucial support level of 39640.
- 50-Day SMA: The 50-day simple moving average (SMA) provides additional support and reinforces the possibility of an upward trend.
- Momentum Indicator: Positive signals on the 14-day momentum indicator further support the bullish bias.
Upward Potential:
As long as intraday trading remains above 39640, the DJIA could continue its upward trajectory, targeting 39960. A break above this level would enhance the chances of further gains, potentially reaching 40180.
Downside Risks:
A close below 39640 on an hourly timeframe would invalidate the bullish scenario and put the index under negative pressure, targeting 39545.
Caution:
- High Risk: The current market environment presents a high level of risk, and potential returns may not justify the risks involved.
- High-Impact Economic Data: Today’s release of high-impact economic data from the US, including testimony from Fed Chairman Jerome Powell and a speech by the US Treasury Secretary, could introduce significant volatility into the market.
- Geopolitical Tensions: Ongoing geopolitical tensions further elevate the risk of heightened price fluctuations.
Overall Assessment:
The technical outlook for the DJIA leans towards cautious optimism, with the potential for further upward movement if key support levels hold. However, traders should exercise extreme caution due to the heightened risk environment, potential for volatility from economic data releases, and ongoing geopolitical tensions.
Disclaimer: Trading in CFDs carries inherent risks, and all scenarios are possible. This analysis is not investment advice but rather an interpretation of the current technical landscape for the Dow Jones Industrial Average.
| S1: |