
The past trading week shaped up to be one of the busiest on the 2026 economic calendar, with multiple narrative threads intertwining at once. Key price drivers included Nvidia’s record-breaking earnings results, the release of the minutes from the final Federal Reserve meeting chaired by Jerome Powell, sharp volatility in oil prices tied to the trajectory of US-Iran negotiations, an ongoing wave of corporate layoffs, and macroeconomic data regarding global inflation readings.
The week followed a pattern that markets have grown accustomed to amidst geopolitical tensions swinging between the fear of war and the hope of peace, sticky inflation, and central banks standing at a historic crossroads.
US Equities — Nvidia Leads the Path from Caution to Optimism
Wall Street kicked off the week retreating from record highs amidst escalating inflationary fears, facing a packed agenda stretching from artificial intelligence to global consumer health and monetary policy trends. However, the mood shifted dramatically midweek following Nvidia’s earnings announcement. The company reported record revenue of $81.6 billion for the first quarter of its fiscal year 2027, up 85% year-over-year and 20% from the previous quarter, with its Data Center segment alone generating $75.2 billion—a 92% surge from last year. The company also beat earnings per share (EPS) expectations by 5.4%, coming in at $1.87 against forecasts of $1.77, marking the fourth consecutive quarter of outpacing Wall Street estimates.
US stocks continued their rally for the eighth consecutive week despite US bond yields rising to levels near their highest three-year ranges, reflecting the strength of current market momentum. This ascent appears fundamentally supported by robust corporate earnings, particularly from technology and AI firms, at a time when investors are increasingly worried about rising inflation, oil prices, and the widening US government debt. Furthermore, markets have begun repricing the probability of Federal Reserve actions; having previously anticipated rate cuts, discussions have shifted toward the possibility of another hike in federal interest rates if current inflationary pressures persist.
Analyst Note: The current situation differs radically from the inflation crisis of 2022. Monetary policy today is already far more restrictive, the labor market is more balanced, and government fiscal support is less aggressive compared to the post-pandemic period. Consequently, analysts believe the US Federal Reserve will not rush into aggressive rate hikes, but will instead maintain a cautious approach, monitoring developments in energy prices and inflation. Additionally, any potential cooling of geopolitical tensions and oil prices could help ease inflationary pressures in the coming period.
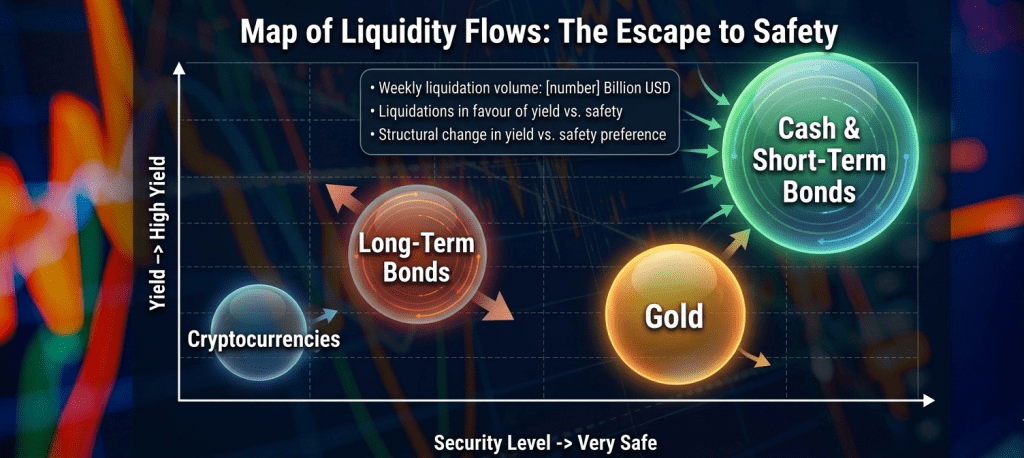
From an investment perspective, rising yields could increase stock volatility and pressure valuations, but they do not yet pose a direct threat to the bull market. Analysts prefer focusing on large- and mid-cap US equities, particularly those tied to artificial intelligence and lower-priced cyclical sectors. In the bond market, short-term bonds currently look more attractive due to their high yields relative to cash, while extending duration into long-term bonds remains risky given persistent inflation and US government debt concerns.
In terms of overall weekly performance:
- Dow Jones rose to a new record high of 50,579 points.
- S&P 500 climbed for the eighth consecutive week—its longest weekly winning streak since 2023—to reach 7,473 points.
- Nasdaq advanced to 26,343 points, with small-cap and value stocks outperforming large-cap and growth counterparts.
Economic Data
However, structural reservations hide behind these optimistic figures. The Flash PMI data released by S&P Global revealed that input costs rose at their fastest pace since late 2022, while the selling price inflation index hit its highest level since August 2022. Employment within the index also declined, with companies attributing the drop in headcount to rising cost concerns and weakening demand. On the consumer front, the University of Michigan consumer sentiment index plunged for the third consecutive month to a record low of 44.8 points, with year-ahead inflation expectations climbing to 4.8% compared to 3.4% before the outbreak of the Middle East conflict.
In the housing market, the National Association of Home Builders (NAHB) reported that its index, at 37 points, remained below the breakeven threshold for the 25th consecutive month, amid mortgage rates climbing to 6.51%—the highest since August.
Bonds, the Dollar, and the Fed — Warsh Inherits a Thorny Portfolio
The week served as a delicate test of US monetary policy credibility in the post-Jerome Powell era. Investor focus centered on the minutes of the latest Federal Open Market Committee (FOMC) meeting, which was chaired by Jerome Powell before he officially handed over the seat to Kevin Warsh. Markets were eager to gauge the hawkishness of committee members regarding inflation following April’s upside surprise. The minutes released on Wednesday revealed a notable escalation in policymakers’ anxieties, with a majority of participants noting the potential for additional policy tightening if inflation remains stubbornly above the 2% target.
US Treasuries
The yield on the 10-year US Treasury note witnessed sharp volatility during the week, climbing from 4.6% to a weekly peak of 4.69% midweek, before retracing to around 4.56% by late Friday. More broadly, yields are rising across developed markets; UK 10-year gilts led the G7 with a yield of 5.18%, followed by Australia at 5.07%, while the Japanese yield climbed from near-zero levels in 2021 to 2.72%.
Adding to this backdrop is the compounding pressure from the US fiscal outlook. Moody’s estimates that the deficit could rise from 6.4% to around 9% of GDP by 2035 in light of the tax reform bill, which has become a primary driver of rising long-term yields. Futures data indicates that rate cut expectations have shifted drastically toward the probability of at least one rate hike over the next twelve months.
The US Dollar Index
As for the US Dollar Index (DXY), it stabilized near the 99 level in a fragile equilibrium between two opposing forces: safe-haven demand on one hand, and escalating fiscal spending pressures that undermine confidence in US assets on the other. The dollar continues its downward trajectory in 2026, losing about 2.17% on a monthly basis, while gold derives structural momentum from this weakness, fueling its 43% rally from the beginning of the year through early May.
Gold — Above $4,500
Gold ended Friday’s trading at $4,521 per ounce, down slightly in the closing session toward a modest weekly negative close as signs of progress in US-Iran peace negotiations emerged. Throughout the week, the precious metal remained captive to conflicting signals: on one hand, Tehran reported that the latest US proposal narrowed part of the gap between the two sides; on the other hand, reports revealed that the Supreme Leader directed the retention of enriched uranium stockpiles, complicating negotiations given that dismantling the nuclear program remains a core US condition.
With inflationary pressures persisting, the probability of a US rate hike before the end of the year rose to around 55%, while Fed Governor Christopher Waller indicated that he no longer sees a need to maintain an easing bias in official forward guidance. Gold retains its structural momentum as a safe haven against both dollar risks and inflation, though it tends to tilt downward whenever signs of an Iranian truce appear on the horizon.
Oil — Diplomacy Translates into Price Pulses
Oil prices this week were less a reflection of the traditional supply-and-demand equation and more a mirror of volatile diplomacy in the Gulf region. Crude prices tumbled by roughly 5.6% on Wednesday to their lowest levels in more than a week following President Trump’s statement that talks with Iran had entered their final stages, leaving Brent at $104.2 and WTI at $97.66. This drop did not last long, as renewed negotiation anxieties returned a portion of the risk premium to prices.
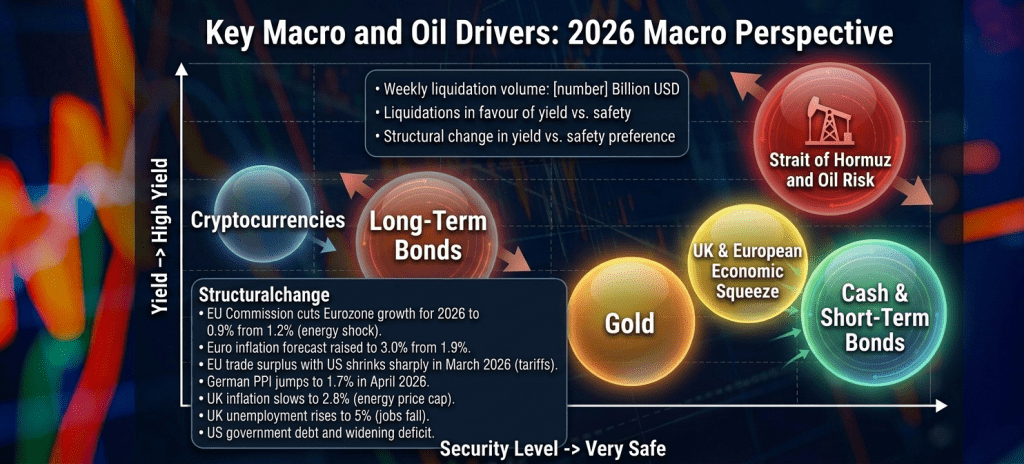
The strategic weight of this file is evident given that roughly one-fifth of global oil consumption passes through the Strait of Hormuz, alongside exports from Saudi Arabia, the UAE, Kuwait, and Iraq that utilize the same strait. This makes every statement or leak regarding negotiations an occasion for an immediate repricing of the geopolitical risk premium in the global energy market.
Prepared By Noor Trends Team
The Euro and European Markets — A Mix of Hope and Austerity
The pan-European STOXX 600 index ended the week with a 3% gain in local currencies, driven by optimism over a potential de-escalation of the Middle East conflict. Germany’s DAX led the way with a 3.92% rise, while France’s CAC 40 climbed 2.05% and the UK’s FTSE 100 gained 2.66%.
However, macroeconomic data painted a bleaker picture than market performance:
- The European Commission cut its Eurozone growth forecast for 2026 to just 0.9% (down from 1.4% in 2025 and its previous estimate of 1.2%), citing a “major energy shock” and a “volatile geopolitical and trade environment.”
- Concurrently, it raised its inflation forecast to 3% from 1.9%.
- On the external trade front, the European trade surplus shrank sharply to €7.8 billion in March 2026, compared to €34.1 billion in March 2025, amid a 38.8% drop in exports to the US due to tariffs imposed since April 2025. The steepest declines were recorded in the chemicals, machinery, and automotive sectors.
Sterling and the UK Economy — Slowing Inflation Amidst a Fractured Labor Market
The British pound endured a contradictory week; the currency tumbled to its lowest level in six weeks under the weight of domestic political turmoil, but economic data provided some support by week’s end. UK annual inflation slowed to 2.8% in April, down from 3.3% in March and below market expectations of 3%. The Office for National Statistics (ONS) attributed this partly to the energy price cap implemented by the regulator, which helped curb price pressures.
Conversely, the UK unemployment rate unexpectedly jumped to 5% in the quarter ending in March, while the number of job vacancies fell 3.9% to 705,000—the lowest level in five years. This contradictory landscape places the Bank of England in a highly delicate position: it seeks lower inflation to justify easing, but the labor market is deteriorating at a pace that makes further tightening untenable.
The Japanese Yen — Close Watch on Inflation Data as Eyes Turn to the BOJ
The release of Japan’s April consumer price index (CPI) data was one of the pivotal milestones of the week, with investors monitoring it as a telling signal for rate hike expectations at the upcoming June meeting. Japanese markets rebounded strongly during this period, with the Nikkei 225 climbing 3.14% and the TOPIX gaining 0.74%, supported by optimism surrounding peace talks and stable oil prices, which boosted risk appetite in the technology and AI sectors.
The Yen remains at the heart of a broader market dynamic; its weakness keeps yen carry-trade financing cheap, supporting leveraged positions across all risk assets, including the crypto derivatives market. Any tightening surprise from the Bank of Japan could trigger a sequential sell-off in global markets, mirroring August 2024 when an unexpected rate hike sent Bitcoin down $15,000 within 48 hours.
The Canadian Dollar — Caught Between Crude Oil and Trading Partner Pressures
The Canadian dollar remained under dual pressure this week. On one hand, the oil-linked currency was impacted by sharp fluctuations in crude prices tied to the Iranian negotiation path. On the other hand, Canadian economic data continued to send contractionary signals across domestic demand sectors. While the Bank of Canada awaits further inflationary moderation, the slowdown in the US economy—its largest trading partner—limits any sustained recovery for the Loonie.
Cryptocurrencies — Recovering from Monday’s Shock
The week opened with a sharp decline, with Bitcoin starting trading at $77,414—its lowest opening price since the beginning of the month—amid a cautious atmosphere that gripped all asset classes as geopolitical tensions escalated. Leveraged liquidations on Monday alone reached $563 million, mostly impacting Bitcoin and Ethereum holders.
The scene gradually reversed following Nvidia’s results and signs of progress in the Iranian negotiations, allowing Bitcoin to reclaim its levels above $79,000 by the end of the week. It is worth noting the structural nature of the pressure on crypto at this stage; macroeconomic factors, ranging from rising yields to tight dollar liquidity and yen carry-trade fluctuations, dominate the landscape far more than technical factors specific to the digital assets themselves.
Prepared By Noor Trends Team
Corporate Layoffs — A Deep Wave of Restructuring Broadens
The wave of corporate restructuring tied to artificial intelligence continued to expand at a striking pace throughout the week.
- Meta redeployed 7,000 employees into new AI-related roles on Wednesday, May 20.
- Standard Chartered announced on Monday, May 19, its intention to eliminate roughly 8,000 support roles over the next four years.
- IKEA Group cut 850 jobs on the same day as part of a cost-cutting campaign in the face of cooling consumer spending.
- Walmart announced the reduction or relocation of approximately 1,000 corporate roles while consolidating its global technology and product teams.
- Oracle pressed ahead with layoffs impacting up to 30,000 employees globally.
Specialized data indicates that over 339 tech companies have executed layoffs in 2026 so far, affecting roughly 143,000 employees at a rate of 1,000 jobs per day—surpassing the 2025 pace of 674 jobs per day. This pattern reflects a phenomenon deeper than mere cost-cutting; companies with surging profits like Meta and Nvidia are laying off workers simultaneously, indicating a comprehensive capital restructuring that redistributes human labor between what AI can perform and what it cannot.
Inflation and Central Banks — The Tightening Symphony Returns
The global inflationary picture this week came in ambiguous, but overall leaned toward persistence rather than retreat. In the Eurozone, the European Commission raised its inflation forecast to 3% from 1.9%, while German producer price inflation (PPI) jumped to 1.7% in April—the highest level since May 2023—driven by intermediate goods and energy prices. In the US, PMI readings and consumer confidence paint a picture of sticky inflation, while analysts warn that the “Big Beautiful” tax bill carries a structural increase in the deficit from 6.4% to around 9% of GDP by 2035, exerting chronic upward pressure on bond yields.
Faced with this reality, Kevin Warsh stands at the helm of the Fed at a highly sensitive juncture. The legacy left by Powell includes inflation above target and market expectations favoring a hike rather than a cut, while the scene is further complicated by public pressure from Trump in favor of easing at the exact same time the tax reform project pushes the deficit in the polar opposite direction.
Geopolitical Developments — Hormuz Holds the Energy Market Compass
Throughout the week, investors maintained a prevailing expectation that the US-Iran negotiation path was more probable than open military escalation, which was reflected in advancing equities and retreating oil and gold by week’s end. However, this conviction remains fragile and subject to change with every statement out of Tehran or Washington.
In Europe, the steep price continental economies are paying due to the fallout of US tariffs and the remnants of the energy shock is gradually unfolding. The European trade surplus shrank to less than a quarter of its March 2025 level due to a nearly 39% drop in exports to the United States, sending a clear economic signal that markets are only halfway through absorbing the costs of trade and geopolitical tensions accumulated since April 2025.
Summary of the May 18 – 22, 2026 Week
The week of May 18 – 22, 2026, mapped out the markets at a rare strategic moment: artificial intelligence pushing corporate earnings to record highs, inflation refusing to retreat, central banks shackled between political pressures and monetary imperatives, and geopolitics rewriting energy supply maps. While markets celebrate Nvidia’s numbers, bonds continue to flash warnings.
| Indicator / Asset | Key Weekly Level / Milestone |
| Nvidia Q1 2027 Revenue | $81.6 Billion (+85% YoY) |
| Dow Jones Industrial Average | Record high of 50,579 points |
| S&P 500 | 7,473 points (8th consecutive weekly gain) |
| US 10-Year Treasury Yield | Peaked at 4.69%, closed near 4.56% |
| Gold (Per Ounce) | $4,521 |
| Brent Crude Oil (Per Barrel) | $104.2 |
| Bitcoin | Reclaimed levels above $79,000 |
The US 30-year bond yield touched 5.2% at one point during the week, its highest since 2007, driven by inflation concerns tied to the Iranian conflict and escalating anxiety over US fiscal conditions. The event most telling of liquidity conditions was Wednesday’s US Treasury auction of 20-year bonds; the $16 billion offering saw tepid demand with a bid-to-cover ratio of just 2.46 times—the weakest since February. Following the auction, the 20-year bond yield climbed to 5.127%, its highest level since November 2023, while stocks and the dollar slid simultaneously.
This landscape reveals a deep structural pattern: the continuous issuance of massive amounts of debt by the Treasury Department is outpacing demand levels, causing the preferential premium that Treasuries once enjoyed among investors to fade. This is clearly visible in long-term bonds, which are more exposed to deficit expansion risks. In some sessions this week, investors resorted to selling their most liquid assets, from precious metals to equities, to obtain the necessary cash in the face of geopolitical uncertainty—a behavior reflecting genuine liquidity pressure rather than ordinary rebalancing.
Ultimately, bond markets are sending a clear warning: with an expanding federal budget, sticky inflation, and accelerating debt supply, sell-offs in long-term bonds have come to reflect a genuine doubt in long-term creditworthiness, rather than a simple repricing of interest rates.
Outlook for the Week of May 26 – 29, 2026
The week of May 26 – 29 is expected to open following the Wall Street closure on Monday for the Memorial Day holiday, narrowing the actual trading window to four days packed with high-impact data milestones. The US agenda will be dominated by heavy data on Thursday, which includes the second estimate of Q1 GDP growth, personal income and spending data—foremost among them the Core PCE Price Index, the Fed’s preferred inflation gauge—alongside durable goods orders, new home sales, and weekly jobless claims.
On the international front:
- Wednesday: New Zealand releases its interest rate decision in its first meeting led by the new Governor, while Australia releases its April inflation data at the same time.
- Friday: The week concludes with German inflation data and Canada’s GDP, while China rolls out its manufacturing and non-manufacturing PMIs at the start of June.
Will the upcoming PCE reading sustain the narrative of sticky inflation and solidify the rate hike bets that markets have begun pricing in, or will it surprise to the downside and reopen an easing window for Kevin Warsh? In parallel, the path of US-Iran negotiations keeps its hand on the trigger of oil prices, as every statement or leak is capable of simultaneously redrawing crude levels and risk premiums alike.