
Gold (XAU/USD) Technical Analysis
Gold prices (XAU/USD) have launched an assault on the psychological $4,700 resistance after several sessions of sideways consolidation, climbing to an intraday high of $4,723 — a development that underscores a clear improvement in buying momentum across the metal.
Technical Outlook – 4-Hour Timeframe:
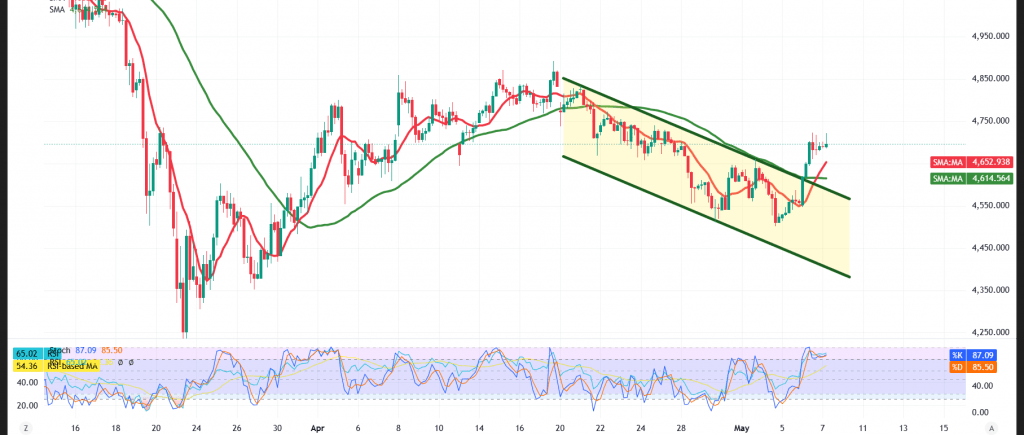
On the short-term horizon, we note the return of the simple moving averages to support the price from below, functioning as dynamic support that reinforces the probability of an extended upside move.
The price has also successfully broken out of a descending price channel — a constructive technical development that lends weight to the case for continued bullish momentum over the upcoming period.
On the flip side, the Relative Strength Index (RSI) has started to flash negative signals after pushing decisively into overbought territory, which could temper the pace of the advance or trigger a temporary corrective pullback.
Given the conflicting nature of the technical readings, we favor a watchful approach to price action in order to identify which of the following scenarios will unfold:
Bearish Scenario:
This scenario would materialize should the price fail to clear the $4,700 barrier and stabilize below $4,605, paving the way toward:
- $4,588 as the initial downside target
It is worth highlighting that a decisive breakdown beneath $4,588 would unlock the door to a deeper bearish wave targeting:
- $4,478
Bullish Scenario:
This scenario would unfold upon a confirmed break above $4,723, which would provide robust support for sustained upside momentum, with targets set at:
- $4,765 as the initial objective
- Followed by $4,830 as the subsequent level
Disclaimer: Trading gold carries substantial risk and may not be suitable for all investors.
Risk Alert: Risk levels remain elevated amid persistent trade frictions and geopolitical tensions — all scenarios should be considered plausible.
Risk Disclaimer: Trading CFDs involves risks, and therefore all scenarios may be plausible. The content above is not a recommendation to sell or buy but rather an explanatory reading of price movement on the chart.
| S1: 4588.00 | R1: 4765.00 |
| S2: 4478.00 | R2: 4832.00 |
| S3: 4411.00 | R3: 4942.00 |


