
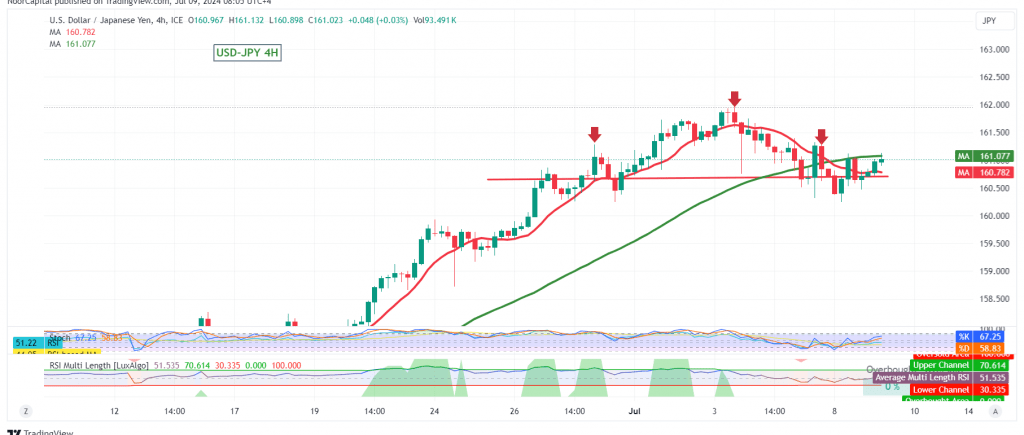
The USD/JPY pair’s recent rally has stalled at a strong resistance level around 161.70, leading to a period of consolidation around 161.00. Technical analysis now suggests a potential shift towards a bearish bias.
Key Technical Signals:
- Resistance Level: The 161.70 level has proven to be a formidable obstacle, halting the pair’s upward momentum.
- 50-Day SMA Breakdown: The price is currently trading below the 50-day simple moving average (SMA), indicating weakening bullish momentum.
- Bearish Head and Shoulders Pattern: The formation of a bearish head and shoulders pattern on the 4-hour chart further supports the potential for a downward correction.
Downward Potential:
The pair is expected to exhibit a bearish bias in the coming hours, with an initial target of 160.50. Further declines could lead to a test of 160.00 and potentially 159.60, which aligns with the official target of the bearish head and shoulders pattern.
Potential Bullish Reversal:
A break above 161.40, followed by consolidation above this level, could invalidate the bearish scenario and reinstate the upward trend. In this case, the pair could revisit 161.70 and potentially move higher towards 162.00.
Caution:
- High Risk: The current market environment presents a high level of risk, and potential returns may not justify the risks involved.
- High-Impact Economic Data: Today’s release of high-impact economic data from the US, including testimony from Fed Chairman Jerome Powell and a speech by the US Treasury Secretary, could introduce significant volatility into the market.
Overall Assessment:
The technical outlook for USD/JPY has shifted towards a bearish bias, with the potential for a downward correction. Traders should closely monitor key support and resistance levels and exercise caution due to the heightened risk environment and potential volatility from upcoming economic events.
Disclaimer: Trading in CFDs carries inherent risks. The analysis provided herein is not a recommendation to buy or sell, but rather an interpretation of the current price movement on the chart.
| S1: |