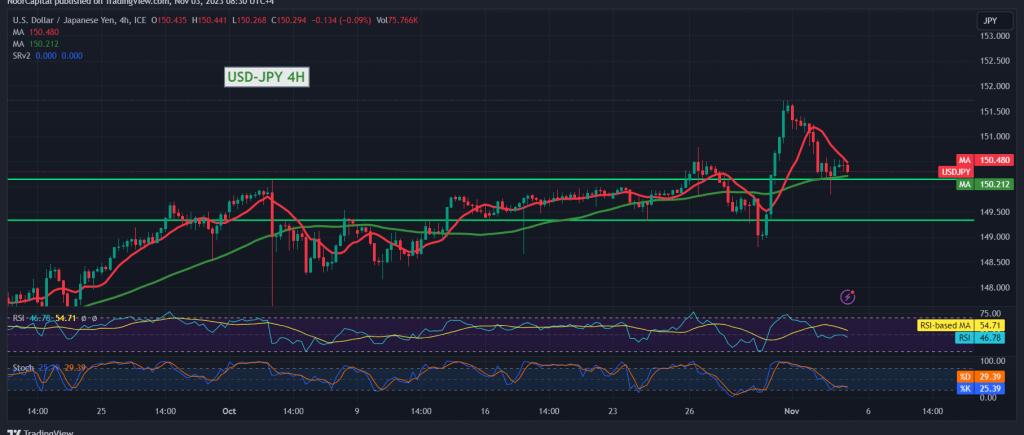
We maintained a neutral stance in our previous technical report due to conflicting signals in the market at the time of issuance. It was noted that a decline below 150.15 would initiate a bearish correction, with the initial target around 149.75. The pair subsequently moved within this projected path, reaching its lowest point at 149.84.
In today’s analysis, a bearish outlook is favored, based on clear negative signals from the Stochastic indicator and the emergence of downward pressure from the 50-day simple moving average above the price.
As long as the pair continues to trade below 150.80/150.70, the bearish scenario remains prominent for the day, targeting 149.80 as the first objective. A break below this level would intensify the bearish momentum, leading the pair towards 149.20, followed by 148.70. These bearish corrective targets remain in play as long as the price remains below 150.80. Traders are advised to monitor these levels for potential market movements.
Please note that we are anticipating high-impact economic data from the American economy, including non-farm payroll, unemployment rates, average wages, and the services purchasing managers index issued by ISM. Additionally, we are awaiting Canadian economic data, specifically the unemployment rate and job changes. Market fluctuations are expected upon the release of these news items.
Note: Trading on CFDs involves risks. Therefore, all scenarios may be possible. This article is not a recommendation to buy or sell but rather an explanatory reading of the price movement on the chart.
| S1: |
 Noor Trends News, Technical Analysis, Educational Tools and Recommendations

