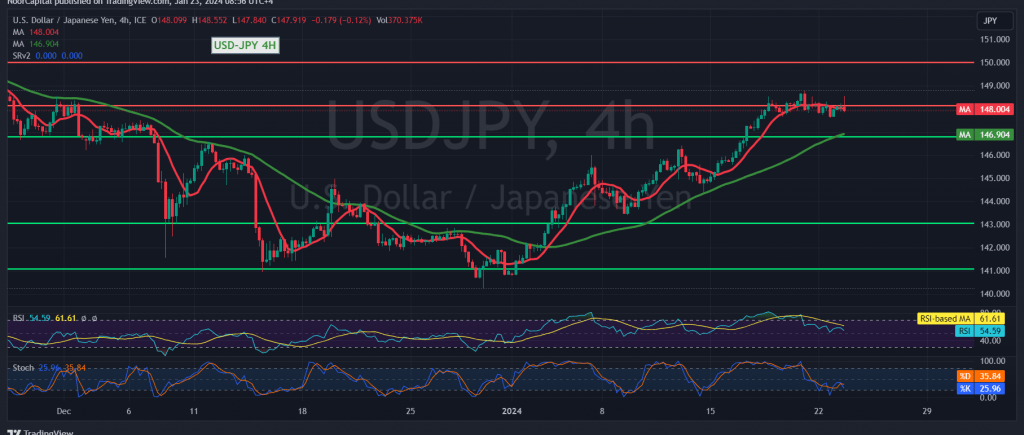
The USD/JPY pair experienced predominantly positive trades, albeit with limited gains, reaching its highest level around 148.55.
Upon closer technical analysis, indications of overbought conditions are beginning to emerge on the Stochastic indicator. Additionally, signs of declining momentum are observable on the 4-hour time frame.
With trading stability below the resistance level of 148.50, there is a potential for a bearish inclination in the coming hours. The initial target for this bearish move is set at a retest of 147.65, and a break below it would exert strong negative pressure, potentially leading the pair towards 147.10.
However, an upward crossover and a rise above 148.60 would nullify the anticipated bearish tendency, prompting an immediate recovery for the pair towards 149.00 and 149.50, respectively.
Traders are advised to exercise caution as the risk level may be high in the current market conditions. Monitoring price movements and technical signals is crucial for making informed trading decisions.
Note: Trading on CFDs involves risks. Therefore, all scenarios may be possible. This article is not a recommendation to buy or sell but rather an explanatory reading of the price movement on the chart.
| S1: |
 Noor Trends News, Technical Analysis, Educational Tools and Recommendations

