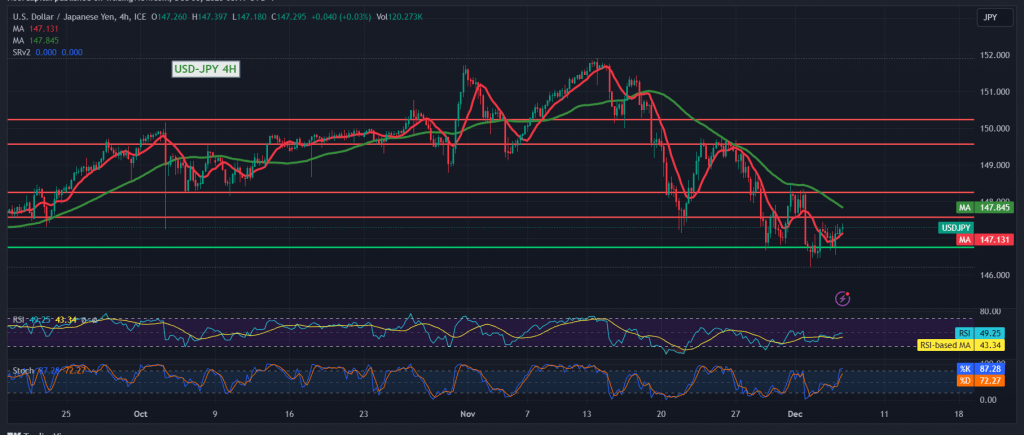
The technical landscape for the USD/JPY pair remains unaltered, with no significant shifts in recent movements. The pair continues to exhibit negative stability, stubbornly positioned below the robust resistance level at 147.60.
From a technical standpoint, our trading bias leans towards negativity, contingent on the pair’s ability to maintain stability below the resistance markers of 147.45 and, crucially, 147.60. This negative stance is reinforced by the influence of the simple moving averages, which are contributing to the maintenance of a daily bearish price trajectory.
The prospects for the continuation of the downward trend remain valid and effective, with a primary target set at 146.75. Attention should be focused on the potential breakthrough of this level, as it would significantly enhance the downward momentum, leading to the next station at 146.20. Subsequent negative targets may extend towards 145.90.
It’s imperative to exercise caution and closely monitor the price action, as the consolidation of the price above 147.60, confirmed by the closing of at least an hourly candle, could prompt the pair to attempt an upward trend. In such a scenario, the initial target for this upward movement is identified at 148.15.
Investors are urged to acknowledge the elevated risk level associated with today’s high-impact economic data from the American economy, particularly the “change in private non-agricultural sector jobs” from Canada. Additionally, the interest statement and rate decision from the Bank of Canada, coupled with the press talk by the Governor of the Bank of England, may contribute to heightened price fluctuations. A cautious and informed approach is recommended to navigate potential volatility in the market.
Note: Trading on CFDs involves risks. Therefore, all scenarios may be possible. This article is not a recommendation to buy or sell but rather an explanatory reading of the price movement on the chart.
| S1: |
 Noor Trends News, Technical Analysis, Educational Tools and Recommendations

