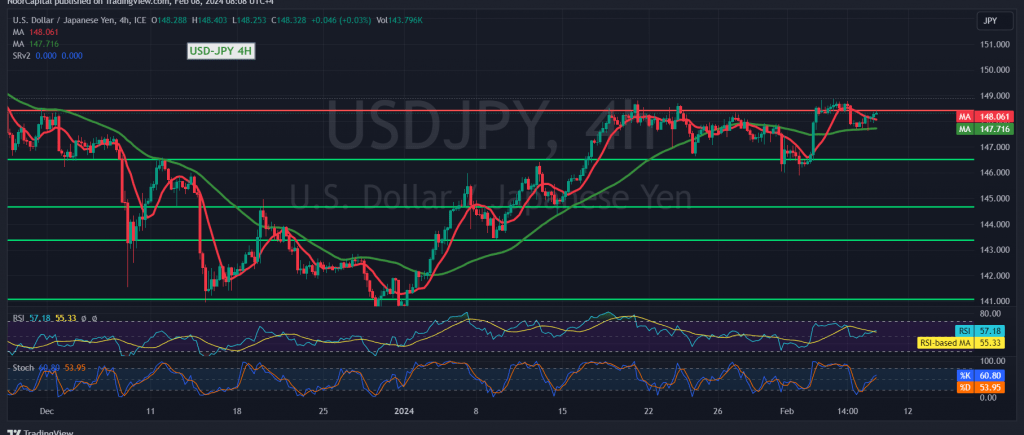
In yesterday’s trading session, a resurgence of positive trades steered the movements of the USD/JPY pair, capitalizing on steadfast stability above the 147.60 support level to initiate advances towards the 148.40 resistance threshold.
Technical Analysis: Stochastic Indicator Signals Caution Amidst Resistance
Today’s technical analysis, scrutinizing the 4-hour timeframe chart, reveals a nuanced picture. While the Stochastic indicator indicates a loss of upward momentum, signaling the onset of intraday buying saturation, the pair struggles to breach the 148.60 resistance level, maintaining a general stabilization below this pivotal point.
Potential Reversal and Downward Trend
The possibility of a resurgence in the downward trend remains valid, particularly if the pair manages to slip below the 147.80 mark. Such a scenario would facilitate a move towards the initial target at 147.30, with 147.00 serving as the subsequent station along this trajectory.
Upside Potential Amid Resistance
However, it’s essential to note that breaching the 148.60 resistance level postpones the prospects of a decline without nullifying them entirely. In such a scenario, the likelihood of an upward trend emerges, potentially targeting a retest of 148.90 and 149.30 before potentially resuming its descent.
Warning: Elevated Risk Amidst Uncertain Market Dynamics
Traders should exercise caution, recognizing the elevated risk level inherent in the current market conditions. Adherence to risk management protocols is paramount to navigating potential fluctuations effectively.
By remaining vigilant and responsive to key technical signals, traders can navigate the dynamics within the USD/JPY pair with prudence and agility.
Note: Trading on CFDs involves risks. Therefore, all scenarios may be possible. This article is not a recommendation to buy or sell but rather an explanatory reading of the price movement on the chart.
| S1: |
 Noor Trends News, Technical Analysis, Educational Tools and Recommendations

