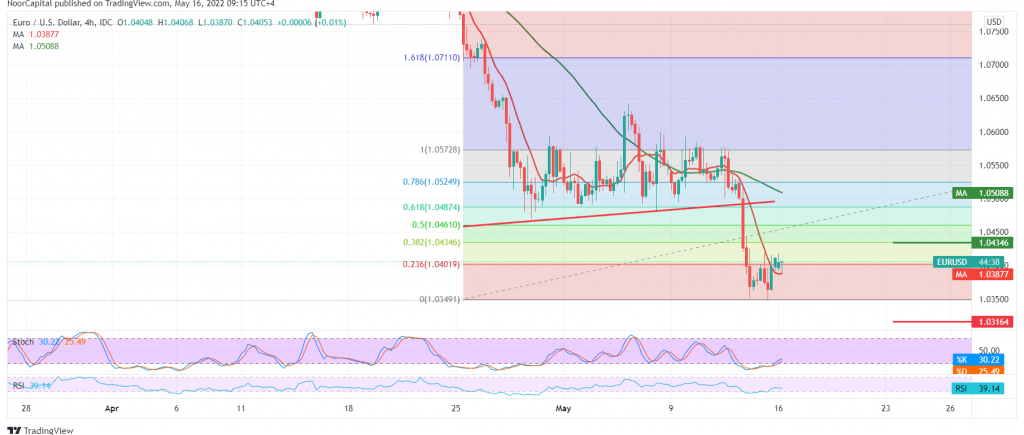
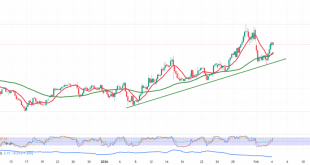
The single European currency maintains negative stability against the US dollar, hitting its lowest level during last week’s trading at around 1.0350.
Technically, by looking at the 4-hour chart, we notice the continuation of the negative pressure coming from the simple moving averages, which still constitute a hindrance to the pair and the 14-day RSI losing the bullish momentum in the short time frames.
Therefore, the bearish scenario remains valid and effective, targeting 1.0320 next official station. The decline below 1.0320 forces the pair to continue the bearish directional movement, opening the door to visit 1.0290 and 1.0260 as long as the price is stable below 1.0460.
Consolidation above 1.0460 50.0% Fibonacci correction, as shown on the graph, may postpone the chances of a decline but not cancel them. We may witness a temporary recovery that aims to retest 1.0510/1.0500 before retracing.
Note: Trading on CFDs involves risks. Therefore, all scenarios may be possible. This article is not a recommendation to buy or sell but rather an explanatory reading of the price movement on the chart.
| S1: 1.0360 | R1: 1.0430 |
| S2: 1.0320 | R2: 1.0500 |
| S3: 1.0290 | R3: 1.0580 |
 Noor Trends News, Technical Analysis, Educational Tools and Recommendations

