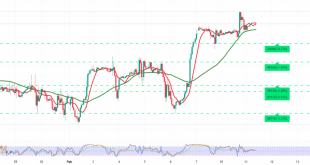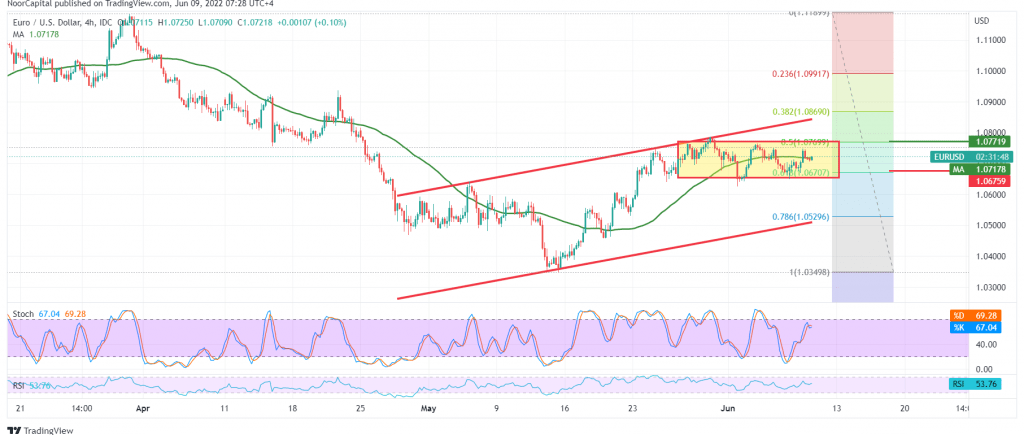
Positive trades dominated the euro’s movements against the US dollar. The pair’s success in consolidating above the strong support level published during the previous analysis at 1.0670 forced it to achieve some bullish bounce to visit 1.0750. We mentioned in the last analysis that the 1.0670 level represents one of the most critical directional keys for the trading levels.
Technically, and with careful consideration on the 4-hour chart, we notice the pair hovering around the 50-day moving average, waiting to push the price to the upside, accompanied by the stability of trading above 1.0670 Fibonacci correction of 61.80%, which supports the possibility of a rise, on the other hand.
Stochastic in overbought and the price stability below the main resistance level 1.0770, 50.0% correction, which supports the possibility of a return to the decline.
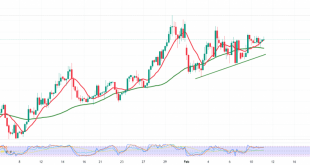
With the conflicting technical signals and the limited trading between the corrections mentioned above, we prefer to monitor the price behavior and wait for a clearer signal to be in front of one of the following scenarios:
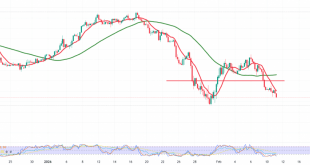
The return of the bearish trend requires stability below 1.0770. We need to witness a clear break of the pivotal support level of 1.0670; this will facilitate the necessary task to visit 1.0600, and the losses will extend towards 1.0570.
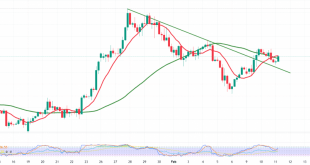
Resuming the bullish bias that started yesterday, we need a breach and stability of the price above the main resistance of 1.0770. That is a motivating factor that may provide opportunities to rise towards 1.0815 and 1.0840, waiting for stations whose gains may extend later towards 1.0860.
Note: ECB monetary policy statement and press conference are due today and may cause some volatility.
Note: Trading on CFDs involves risks. Therefore, all scenarios may be possible. This article is not a recommendation to buy or sell but rather an explanatory reading of the price movement on the chart.
| S1: 1.0670 | R1: 1.0770 |
| S2: 1.0620 | R2: 1.0815 |
| S3: 1.0570 | R3: 1.0865 |