
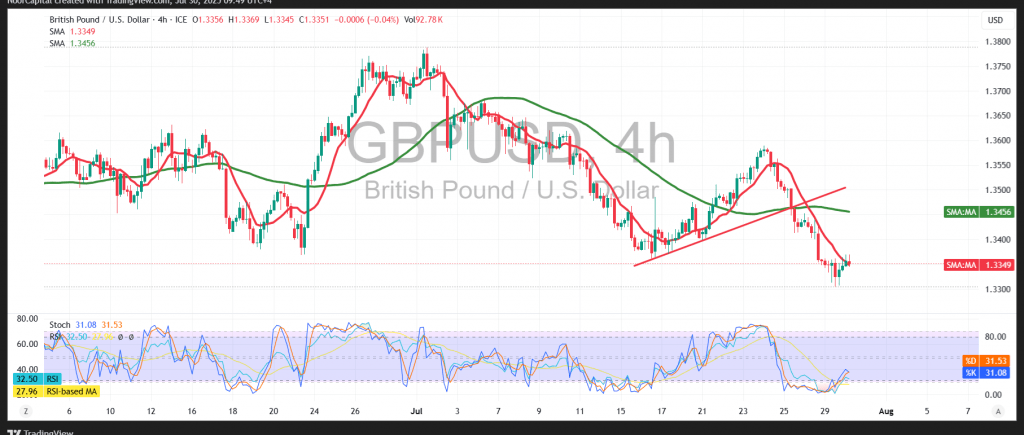
The British pound extended its decline against the U.S. dollar, reaching the first target outlined in our previous technical report at 1.3310, with the pair recording a low of 1.3308.
Technical Outlook:
Intraday movements reveal a modest upward bias as the pair approaches the psychological support level of 1.3300. However, a closer examination of the chart shows the Relative Strength Index (RSI) beginning to send bearish signals, as it retreats from overbought territory—potentially capping any immediate gains. Additionally, the 50-period Simple Moving Average (SMA) continues to serve as a strong dynamic resistance level, reinforcing the bearish tone.
Probable Scenario:
A continuation of the downward trend is likely during today’s session. A confirmed break below the 1.3310 level would likely intensify selling pressure, opening the way toward the next target at 1.3280. A further break of this level would extend the bearish move toward 1.3250.
Alternative Scenario:
If the pair stabilizes above the 1.3380 resistance level, this may signal an early attempt at recovery, with initial upside potential toward 1.3405, followed by 1.3440.
High-Impact Events – Volatility Alert:
Traders should exercise caution today as markets await a series of high-impact U.S. economic releases, including:
- Non-Farm Payrolls (ADP)
- Quarterly GDP data
- Federal Reserve interest rate decision
- FOMC statement
- Press conference by Fed Chair Jerome Powell
These events may result in elevated market volatility across major currency pairs, including GBP/USD.
Warning:
With heightened geopolitical and trade uncertainties, the risk level remains elevated. All scenarios should be considered, and traders are advised to implement appropriate risk management.
Disclaimer: Trading in CFDs carries inherent risks. The analysis provided herein is not a recommendation to buy or sell, but rather an interpretation of the current price movement on the chart.
| S1: |