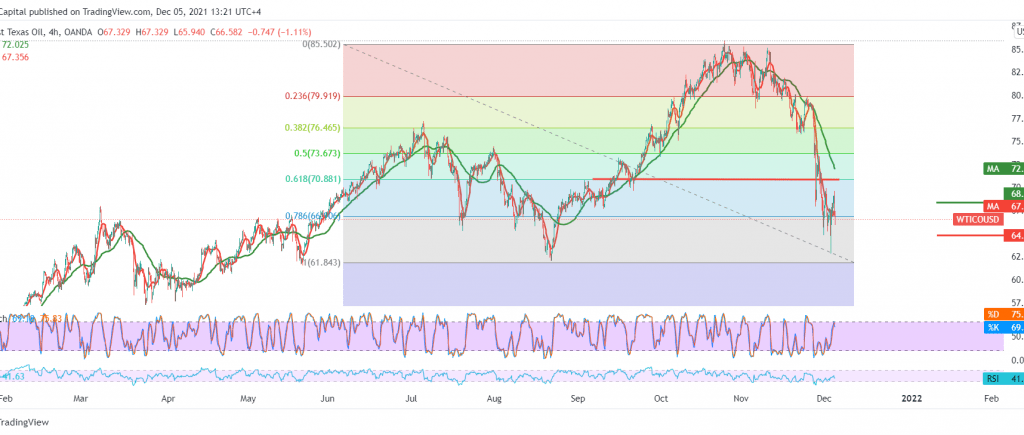
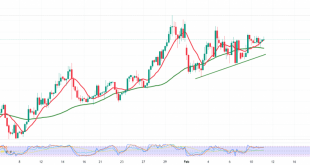
We referred to the temporary rise in the previous analysis, clarifying that the target is to retest 69.60 but recorded a top at 69.25.
Technically, the simple moving averages still constitute an obstacle to oil prices and converge around the resistance level of 67.40 on the short time frame, in addition to the stochastic indicator reaching the overbought areas.
Therefore, we tend to the negativity, but cautiously, targeting the 64.80 first target. However, breaking it increases the strength of the daily bearish trend, so that we will be waiting for 63.65 following the price stop.
Activating the bearish scenario depends on the stability of daily trading during the session below the 67.40 level, and its breach will reinforce the intraday losses for oil to visit 68.40 initially. However, the gains may extend later towards 70.80, 61.80% correction.
Note: The level of risk is high
| S1: 64.80 | R1: 68.45 |
| S2: 63.65 | R2: 70.90 |
| S3: 61.30 | R3: 72.10 |
 Noor Trends News, Technical Analysis, Educational Tools and Recommendations

