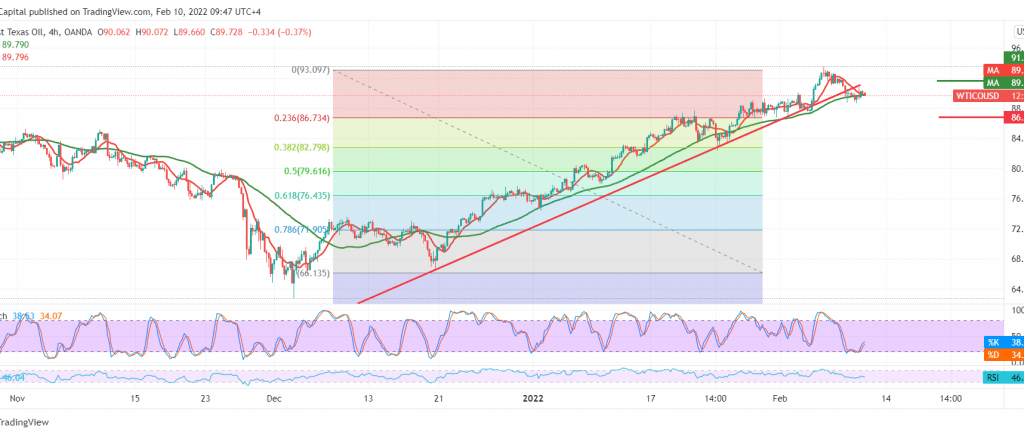
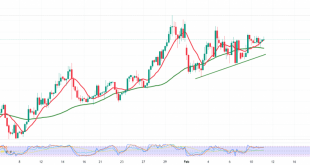
Negative trading dominated the prices of US crude oil futures contracts within the expected bearish slope during the last analysis, heading to visit the official target for the bearish slope at 88.30 to record its lowest level at 88.40.
Technically, we find signs of negativity continuing to dominate the stochastic indicator, which started to lose the bullish momentum gradually on the 4-hour time frame, in addition to breaking the support line of the bullish price channel shown on the graph.
As long as the price is stable below the resistance level 90.70/90.60, the oil may resume the bearish correction tendency to visit 88.45 and 87.40, respectively. Therefore, pay attention because breaking the latter may extend the bearish corrective slope towards areas of 86.80.
The attempt to consolidate and stabilize above 90.60 will postpone the idea of the decline, and we may witness a retest of 91.60 to determine the next price direction.
Note: The risk level may be high.
Note: Trading on CFDs involves risks. Therefore, all scenarios may be possible. This article is not a recommendation to buy or sell but rather an explanatory reading of the price movement on the chart.
| S1: 88.45 | R1: 90.60 |
| S2: 87.40 | R2: 91.65 |
| S3: 86.30 | R3: 92.75 |
 Noor Trends News, Technical Analysis, Educational Tools and Recommendations

