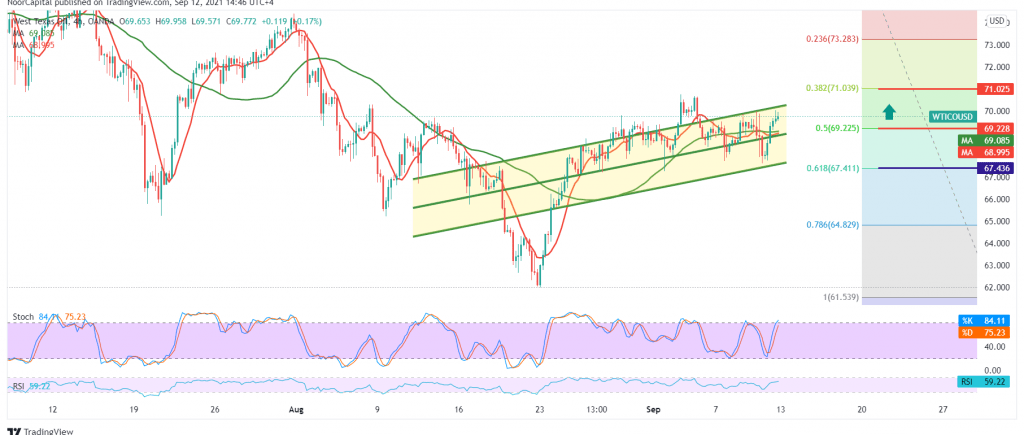
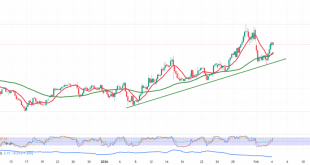
US crude oil futures prices jumped within the expected bullish path, heading to touch the second official target during the last session at 69.25, to record its highest level of 69.93.
Technically, by looking at the 60-minute chart, we find the 50-day moving average that supports the bullish price curve, accompanied by the price continuing to receive positive signals from RSI.
From here, trading steadily above the previously breached resistance level 69.25, 50.0% Fibonacci correction, and generally above 68.40, the bullish scenario remains valid and active, targeting 70.25 first target, and then 71.10, 38.20% Fibo.
On the downside, trading stability returns below 68.40, which will stop the bullish scenario and put the price under temporary negative pressure, targeting a retest of 67.40, 61.80% correction, before attempts to rise again.
| S1: 68.70 | R1: 70.25 |
| S2: 67.80 | R2: 70.90 |
| S3: 67.20 | R3: 71.70 |
 Noor Trends News, Technical Analysis, Educational Tools and Recommendations

