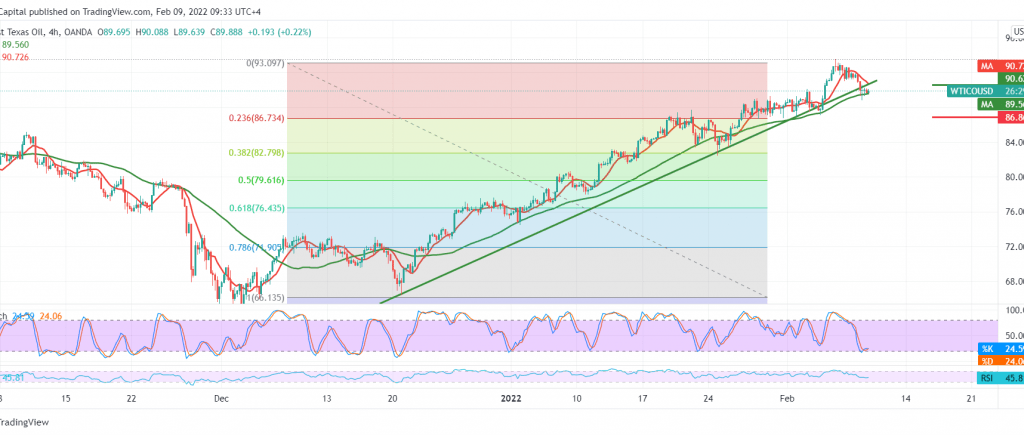
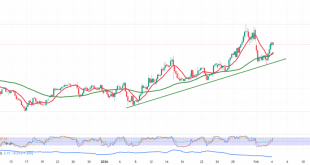
US crude oil prices declined significantly within the expected bearish technical outlook, indicating that we are waiting for a bearish bias to visit 89.80, to record the lowest level at 88.50.
Technically, oil prices failed to maintain trading above the support line of the ascending price channel shown on the chart at 90.75. In addition, we notice the negative pressure coming from the 50-day simple moving average.
The idea of continuing the decline may be valid and effective during the current session’s trading to visit 88.30, taking into account that breaking the mentioned level may extend oil’s losses towards 86.80 as long as the price is stable below 90.75.
Note: IEA is due today, and we may witness high volatility in prices.
Note: Trading on CFDs involves risks. Therefore, all scenarios may be possible. This article is not a recommendation to buy or sell but rather an explanatory reading of the price movement on the chart.
| S1: 88.30 | R1: 91.40 |
| S2: 86.80 | R2: 93.05 |
| S3: 85.15 | R3: 94.50 |
 Noor Trends News, Technical Analysis, Educational Tools and Recommendations

