
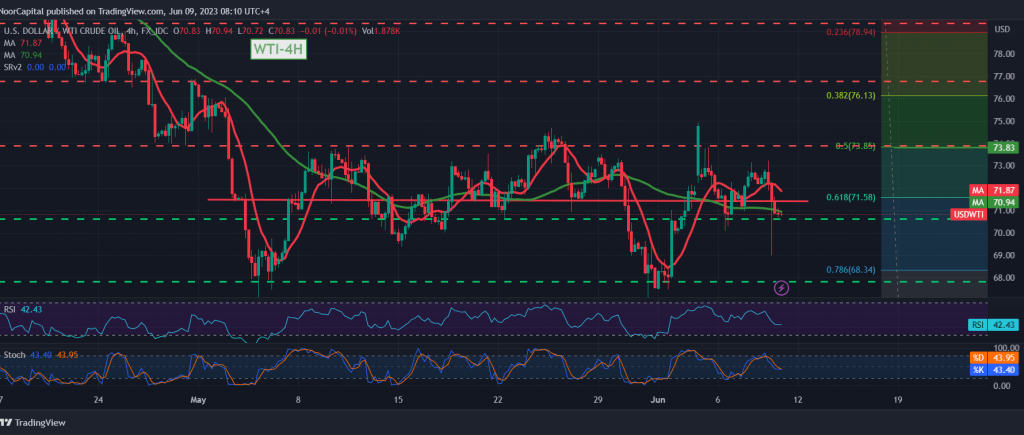
We adhered to intraday neutrality during the previous technical report, explaining that we are waiting for the pending orders to be activated. We explained that breaking 71.55 leads oil prices to a bearish solid path with a target of 70.10, recording its lowest level at $69.10 per barrel.
Technically, the current movements of oil prices are witnessing stability below the previously broken support at 71.55, represented by 61.80% Fibonacci correction, as shown on the 4-hour chart, and the decline in the bullish momentum on the short time frames.
Therefore, resuming the decline is the most preferable, knowing that trading remaining below 70.50 facilitates the task required to visit 70.00 as the first target, and then 69.00 unless we witness any trading above 71.55.
We remind you that the upside move and the price’s consolidation above 71.55 can thwart the bearish scenario immediately, and oil begins to recover, heading to retest at 73.00.
Note: The risk level is high.
Note: Trading on CFDs involves risks. Therefore, all scenarios may be possible. This article is not a recommendation to buy or sell but rather an explanatory reading of the price movement on the chart.
| S1: |