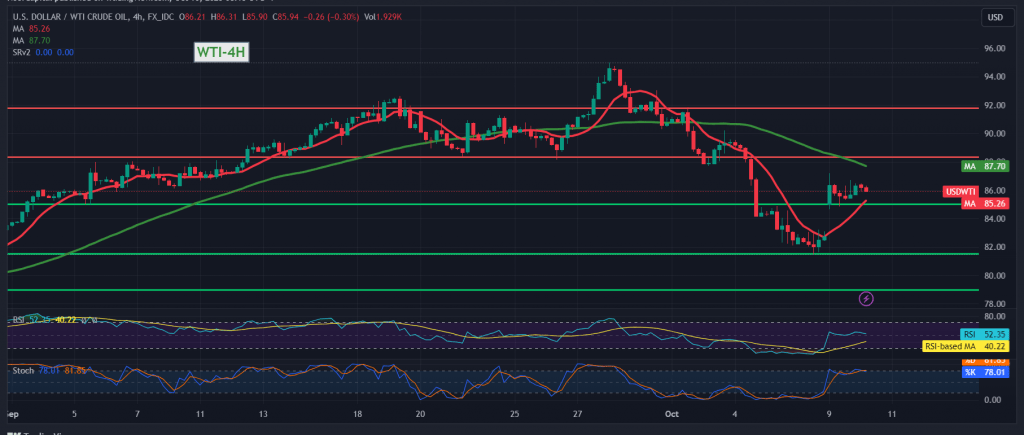
US crude oil futures prices extended their gains to achieve gains estimated at more than 5.0%, reaching $87.15 per barrel.
Technically, the level of 87.00 formed a strong resistance level that succeeded in limiting the rise. With a closer look at the chart with a time interval of 240 minutes, we find a resistance level of 87.00 that meets around the 50-day simple moving average and adds more strength to it, and this comes in conjunction with the features of negativity that began to appear on stochastic indicator.
Therefore, it may be possible to cover the rising price gap, targeting 85.00 as the first target, and breaking it increases and accelerates the expected downward trend, as we wait to touch 82.60.
Only from above does trading stabilize again above 87.00. This invalidates the activation of covering the price gap, as shown on the chart, and leads oil prices to resume upward with targets of 88.20 and 90.50.
Note: Risk level may be high.
Note: Trading on CFDs involves risks. Therefore, all scenarios may be possible. This article is not a recommendation to buy or sell but rather an explanatory reading of the price movement on the chart.
| S1: |
 Noor Trends News, Technical Analysis, Educational Tools and Recommendations

