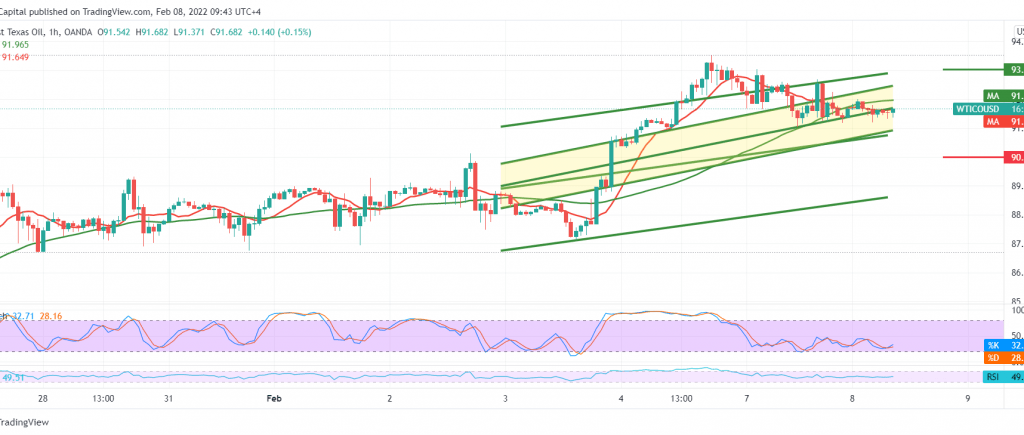
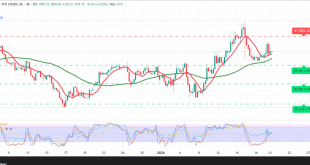
Negative trades dominated the price movements of US crude oil futures after it failed to maintain its gains above the psychological barrier of 92.00, explaining during the previous analysis that the return of stability below 91.40 represents a negative pressure factor that aims to retest 90.75, recording the lowest price of 90.72.
Technically and carefully looking at the 60-minute chart, we notice the RSI losing the bullish momentum, in addition to the stability of trading below 92.00 and, most importantly 92.25.
We may witness a bearish bias in the coming hours to visit 90.50 and 90.00, respectively, and it may extend towards 89.80 as long as the price is stable below the resistance level of 92.25.
Rising above 92.25 may cancel the view of the bearish tendency, lead oil prices to the official bullish path to visit the 93.00s.
Note: the level of risk is high.
Note: Trading on CFDs involves risks. Therefore, all scenarios may be possible. This article is not a recommendation to buy or sell but rather an explanatory reading of the price movement on the chart.
| S1: 90.50 | R1: 92.10 |
| S2: 89.80 | R2: 93.05 |
| S3: 88.85 | R3: 93.75 |
 Noor Trends News, Technical Analysis, Educational Tools and Recommendations

