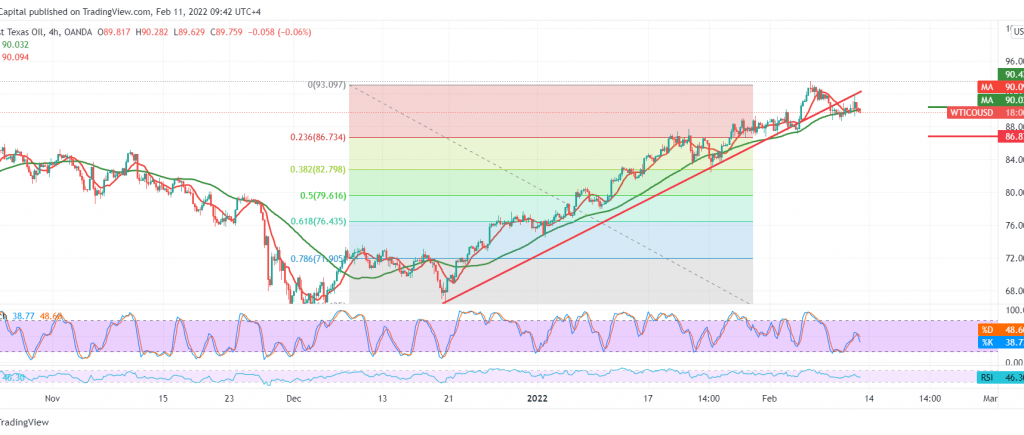
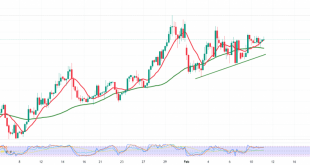
US crude oil futures prices found a pivotal resistance level around 91.60; we are watching the behavior of oil near the mentioned level to determine the next price destination.
Technically, the aforementioned resistance level managed to limit the gains and forced oil to trade negatively again, recording its lowest level at 89.00. However, carefully considering the chart, we find that oil succeeded in breaking the support line of the ascending price channel around 90.60, and we notice that the 14-day momentum indicator started sending negative signals at short intervals.
There may be a possibility of resuming the bearish corrective slope we mentioned during the last visit of 88.45. Breaking it may extend the said bearish slope to visit 87.40 initially, as long as the price is stable below 90.50.
Note: The risk level may be high.
Note: Trading on CFDs involves risks. Therefore, all scenarios may be possible. This article is not a recommendation to buy or sell but rather an explanatory reading of the price movement on the chart.
| S1: 88.45 | R1: 91.10 |
| S2: 87.40 | R2: 92.75 |
| S3: 85.70 | R3: 93.85 |
 Noor Trends News, Technical Analysis, Educational Tools and Recommendations

