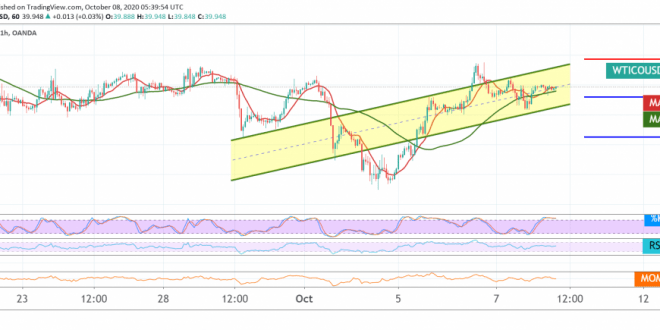
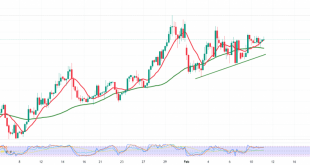
The attempts to rise in US crude oil futures continue within attempts to benefit from the intraday stability above the support level of 39.70, above 39.30 in general.
Technically, looking at the 60-minute chart, we find that the RSI indicator continues to seek positive signals with the positive signs of the 50-day moving average, which meets around 39.30, on the other hand, we find that the stochastic indicator has started losing bullish momentum On an interval of 240 minutes.
Conflicting technical signals push us to remain neutral until the direction is clearer, in order to be one of the following scenarios:
Activating long positions needs a clear break above the 40.25 resistance level, which will enhance the chances of a bullish move towards 41.00 / 40.90, and then 41.40 as a next target.
Activating short positions depends on breaking the support level of 39.65 to target 39.30, while observing the price behavior of oil around 39.30, because confirming its breakout will put the price under negative pressure, its initial target at 38.65 and it may extend towards 38.20.
| S1: 39.30 | R1: 40.35 |
| S2: 38.65 | R2: 40.90 |
| S3: 38.10 | R3: 41.45 |
 Noor Trends News, Technical Analysis, Educational Tools and Recommendations

