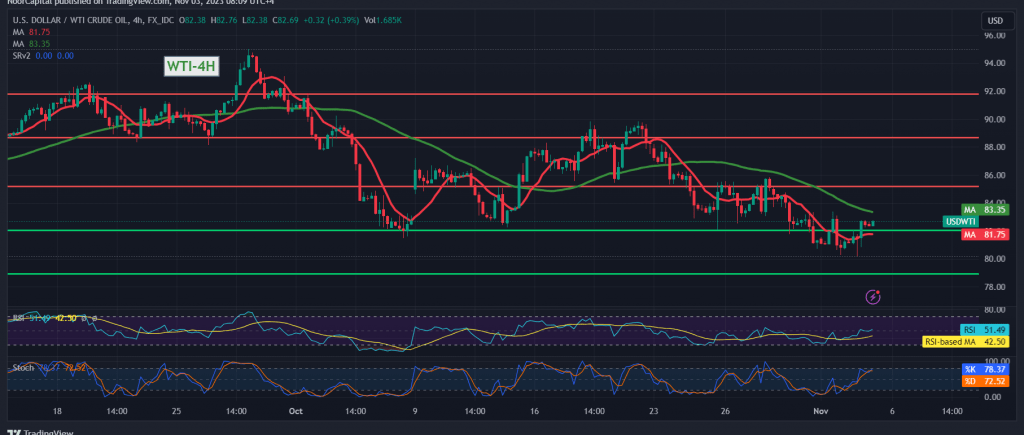
Limited positive attempts marked the movements of US crude oil futures in the previous trading session, with the price reaching its peak at $82.86 per barrel before retracing back within the anticipated downward trajectory and hitting a low of $82.27.
Examining the 4-hour timeframe chart, the 50-day simple moving average acts as a significant hurdle for the price, intersecting around 83.55 and bolstering its resistance. Additionally, the 14-day momentum indicator exhibits clear negative signals.
Given these technical indicators, the bearish scenario remains the most favorable. The initial target is set at 80.30, and it is crucial to closely monitor this level as a break below it could extend oil’s losses, opening the path directly towards 79.30.
Conversely, a breakout above 83.55, accompanied by price consolidation, would thwart the proposed bearish scenario. In such a case, the oil price could see a recovery, to retest the 84.50 level initially. Traders should stay vigilant and consider these key levels for potential market moves.
Please note that we are anticipating high-impact economic data from the American economy, including non-farm payroll, unemployment rates, average wages, and the services purchasing managers index issued by ISM. Additionally, we are awaiting Canadian economic data, specifically the unemployment rate and job changes. Market fluctuations are expected upon the release of these news items.
Note: Trading on CFDs involves risks. Therefore, all scenarios may be possible. This article is not a recommendation to buy or sell but rather an explanatory reading of the price movement on the chart.
| S1: |
 Noor Trends News, Technical Analysis, Educational Tools and Recommendations

